37 lines
No EOL
1.6 KiB
Markdown
37 lines
No EOL
1.6 KiB
Markdown
# Debug
|
|
|
|
Native VSCode debugger. Currently only using GDB.
|
|
|
|

|
|
|
|
## Usage
|
|
|
|
|
|
|
|
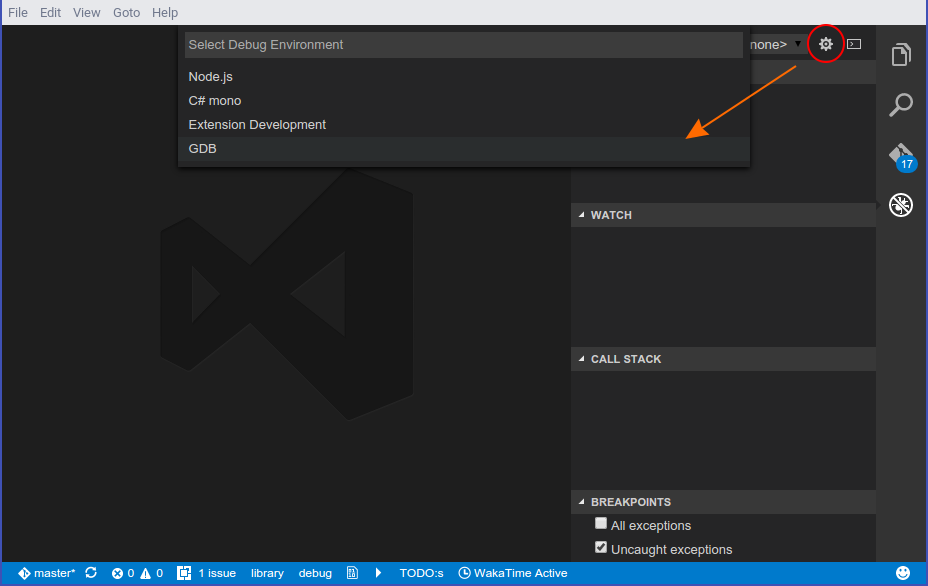
Open your project and click the debug button in your sidebar. At the top right press
|
|
the little gear icon and select GDB. It will automatically generate the configuration
|
|
you need.
|
|
|
|
|
|
|
|
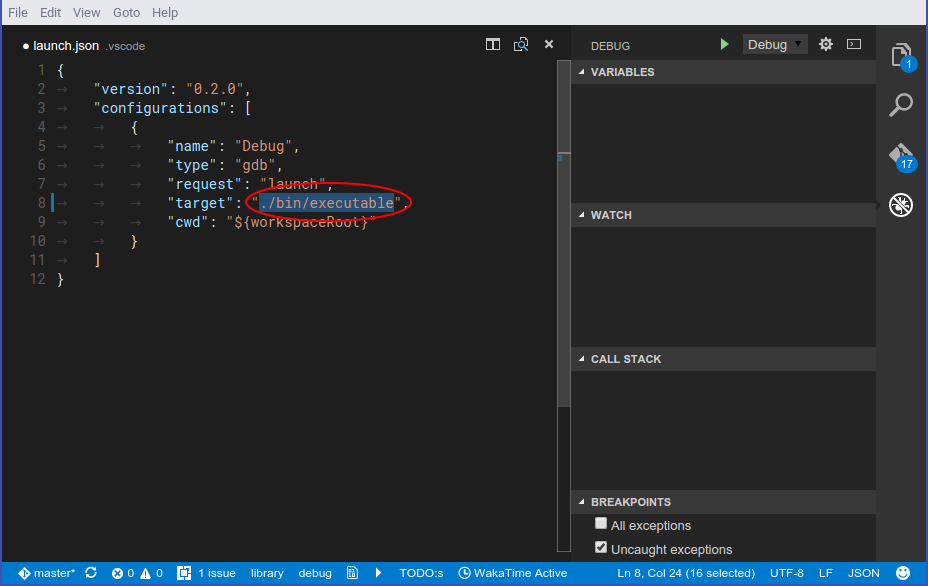
Now you need to change `target` to the application you want to debug relative
|
|
to the cwd. (Which is the workspace root by default)
|
|
|
|
Before debugging you need to compile your application first, then you can run it using
|
|
the green start button in the debug sidebar. Multithreading and removing breakpoints
|
|
while running does not work at the time of writing. Also stopping the program sometimes
|
|
does not work properly.
|
|
|
|
Extending variables is very limited as it does not support child values of variables.
|
|
Watching expressions works partially but the result does not get properly parsed and
|
|
it shows the raw GDB output of the command. It will run `data-evaluate-expression`
|
|
to check for variables.
|
|
|
|
While running you will get a console where you can manually type GDB commands or GDB/MI
|
|
commands prepended with a hyphen `-`. The console shows all output GDB gives separated
|
|
in `stdout` for the application, `stderr` for errors and `log` for GDB log messages.
|
|
|
|
Some exceptions/signals like segmentation faults will be catched and displayed but
|
|
it does not support for example most D exceptions.
|
|
|
|
## [Issues](https://github.com/WebFreak001/code-debug) |