1910 lines
67 KiB
Markdown
1910 lines
67 KiB
Markdown
# vimspector - A multi language graphical debugger for Vim
|
|
|
|
For a tutorial and usage overview, take a look at the
|
|
[Vimspector website][website]
|
|
|
|
 [](https://gitter.im/vimspector/Lobby?utm_source=badge&utm_medium=badge&utm_campaign=pr-badge)
|
|
|
|
<!--ts-->
|
|
* [Features and Usage](#features-and-usage)
|
|
* [Supported debugging features](#supported-debugging-features)
|
|
* [Supported languages](#supported-languages)
|
|
* [Other languages](#other-languages)
|
|
* [Installation](#installation)
|
|
* [Quick Start](#quick-start)
|
|
* [Dependencies](#dependencies)
|
|
* [Neovim differences](#neovim-differences)
|
|
* [Windows differences](#windows-differences)
|
|
* [Trying it out](#trying-it-out)
|
|
* [Cloning the plugin](#cloning-the-plugin)
|
|
* [Install some gadgets](#install-some-gadgets)
|
|
* [VimspectorInstall and VimspectorUpdate commands](#vimspectorinstall-and-vimspectorupdate-commands)
|
|
* [install_gadget.py](#install_gadgetpy)
|
|
* [Manual gadget installation](#manual-gadget-installation)
|
|
* [The gadget directory](#the-gadget-directory)
|
|
* [Upgrade](#upgrade)
|
|
* [About](#about)
|
|
* [Background](#background)
|
|
* [Status](#status)
|
|
* [Experimental](#experimental)
|
|
* [Mappings](#mappings)
|
|
* [Visual Studio / VSCode](#visual-studio--vscode)
|
|
* [Human Mode](#human-mode)
|
|
* [Usage](#usage)
|
|
* [Launch and attach by PID:](#launch-and-attach-by-pid)
|
|
* [Launch with options](#launch-with-options)
|
|
* [Debug configuration selection](#debug-configuration-selection)
|
|
* [Get configurations](#get-configurations)
|
|
* [Breakpoints](#breakpoints)
|
|
* [Exception breakpoints](#exception-breakpoints)
|
|
* [Clear breakpoints](#clear-breakpoints)
|
|
* [Run to Cursor](#run-to-cursor)
|
|
* [Stepping](#stepping)
|
|
* [Variables and scopes](#variables-and-scopes)
|
|
* [Watches](#watches)
|
|
* [Watch autocompletion](#watch-autocompletion)
|
|
* [Stack Traces](#stack-traces)
|
|
* [Program Output](#program-output)
|
|
* [Console](#console)
|
|
* [Console autocompletion](#console-autocompletion)
|
|
* [Log View](#log-view)
|
|
* [Closing debugger](#closing-debugger)
|
|
* [Debug adapter configuration](#debug-adapter-configuration)
|
|
* [C, C , Rust, etc.](#c-c-rust-etc)
|
|
* [Rust](#rust)
|
|
* [Remote debugging](#remote-debugging)
|
|
* [Remote launch and attach](#remote-launch-and-attach)
|
|
* [Python](#python)
|
|
* [Remote Debugging](#remote-debugging-1)
|
|
* [Remote launch and attach](#remote-launch-and-attach-1)
|
|
* [Legacy: vscode-python](#legacy-vscode-python)
|
|
* [TCL](#tcl)
|
|
* [C♯](#c)
|
|
* [Go](#go)
|
|
* [PHP](#php)
|
|
* [Debug web application](#debug-web-application)
|
|
* [Debug cli application](#debug-cli-application)
|
|
* [JavaScript, TypeScript, etc.](#javascript-typescript-etc)
|
|
* [Java](#java)
|
|
* [Usage with YouCompleteMe](#usage-with-youcompleteme)
|
|
* [Other LSP clients](#other-lsp-clients)
|
|
* [Lua](#lua)
|
|
* [Other servers](#other-servers)
|
|
* [Customisation](#customisation)
|
|
* [Changing the default signs](#changing-the-default-signs)
|
|
* [Sign priority](#sign-priority)
|
|
* [Changing the default window sizes](#changing-the-default-window-sizes)
|
|
* [Changing the terminal size](#changing-the-terminal-size)
|
|
* [Advanced UI customisation](#advanced-ui-customisation)
|
|
* [Customising the WinBar](#customising-the-winbar)
|
|
* [Example](#example)
|
|
* [FAQ](#faq)
|
|
* [Motivation](#motivation)
|
|
* [License](#license)
|
|
* [Sponsorship](#sponsorship)
|
|
|
|
<!-- Added by: ben, at: Sun 22 Nov 2020 14:35:00 GMT -->
|
|
|
|
<!--te-->
|
|
|
|
# Features and Usage
|
|
|
|
The plugin is a capable Vim graphical debugger for multiple languages.
|
|
It's mostly tested for c++, python and TCL, but in theory supports any
|
|
language that Visual Studio Code supports (but see caveats).
|
|
|
|
The [Vimspector website][website] has an overview of the UI, along with basic
|
|
instructions for configuration and setup.
|
|
|
|
But for now, here's a (rather old) screenshot of Vimsepctor debugging Vim:
|
|
|
|
|
|
|
|
And a couple of brief demos:
|
|
|
|
[](https://asciinema.org/a/VmptWmFHTNLPfK3DVsrR2bv8S)
|
|
|
|
[](https://asciinema.org/a/1wZJSoCgs3AvjkhKwetJOJhDh)
|
|
|
|
## Supported debugging features
|
|
|
|
- flexible configuration syntax that can be checked in to source control
|
|
- breakpoints (function, line and exception breakpoints)
|
|
- conditional breakpoints (function, line)
|
|
- step in/out/over/up, stop, restart
|
|
- run to cursor
|
|
- launch and attach
|
|
- remote launch, remote attach
|
|
- locals and globals display
|
|
- watch expressions with autocompletion
|
|
- call stack display and navigation
|
|
- variable value display hover
|
|
- interactive debug console with autocompletion
|
|
- launch debugee within Vim's embedded terminal
|
|
- logging/stdout display
|
|
- simple stable API for custom tooling (e.g. integrate with language server)
|
|
|
|
## Supported languages
|
|
|
|
The following table lists the languages that are "built-in" (along with their
|
|
runtime dependencies). They are categorised by their level of support:
|
|
|
|
* `Tested` : Fully supported, Vimspector regression tests cover them
|
|
* `Supported` : Fully supported, frequently used and manually tested
|
|
* `Experimental`: Working, but not frequently used and rarely tested
|
|
* `Legacy`: No longer supported, please migrate your config
|
|
|
|
| Language | Status | Switch (for `install_gadget.py`) | Adapter (for `:VimspectorInstall`) | Dependencies |
|
|
|--------------------|--------------|----------------------------------|------------------------------------|--------------------------------------------|
|
|
| C, C++, etc. | Tested | `--all` or `--enable-c` | vscode-cpptools | mono-core |
|
|
| Rust, C, C++, etc. | Supported | `--force-enable-rust` | CodeLLDB | Python 3 |
|
|
| Python | Tested | `--all` or `--enable-python` | debugpy | Python 2.7 or Python 3 |
|
|
| Go | Tested | `--enable-go` | vscode-go | Go, [Delve][] |
|
|
| TCL | Supported | `--all` or `--enable-tcl` | tclpro | TCL 8.5 |
|
|
| Bourne Shell | Supported | `--all` or `--enable-bash` | vscode-bash-debug | Bash v?? |
|
|
| Lua | Supported | `--all` or `--enable-lua` | local-lua-debugger-vscode | Node >=12.13.0, Npm, Lua interpreter |
|
|
| Node.js | Supported | `--force-enable-node` | vscode-node-debug2 | 6 < Node < 12, Npm |
|
|
| Javascript | Supported | `--force-enable-chrome` | debugger-for-chrome | Chrome |
|
|
| Java | Supported | `--force-enable-java ` | vscode-java-debug | Compatible LSP plugin (see [later](#java)) |
|
|
| C# (dotnet core) | Experimental | `--force-enable-csharp` | netcoredbg | DotNet core |
|
|
| C# (mono) | Experimental | `--force-enable-csharp` | vscode-mono-debug | Mono |
|
|
| Python.legacy | Legacy | `--force-enable-python.legacy` | vscode-python | Node 10, Python 2.7 or Python 3 |
|
|
|
|
## Other languages
|
|
|
|
Vimspector should work for any debug adapter that works in Visual Studio Code.
|
|
|
|
To use Vimspector with a language that's not "built-in", see this
|
|
[wiki page](https://github.com/puremourning/vimspector/wiki/languages).
|
|
|
|
# Installation
|
|
|
|
## Quick Start
|
|
|
|
There are 2 installation methods:
|
|
|
|
* Using a release tarball and vim packages
|
|
* Using a clone of the repo (e.g. package manager)
|
|
|
|
Release tarballs come with debug adapters for the default languages
|
|
pre-packaged. To use a release tarball:
|
|
|
|
1. Check the dependencies
|
|
2. Untar the release tarball for your OS into `$HOME/.vim/pack`:
|
|
|
|
```
|
|
$ mkdir -p $HOME/.vim/pack
|
|
$ curl -L <url> | tar -C $HOME/.vim/pack zxvf -
|
|
```
|
|
|
|
3. Add `packadd! vimspector` to you `.vimrc`
|
|
|
|
4. (optionally) Enable the default set of mappings:
|
|
|
|
```
|
|
let g:vimspector_enable_mappings = 'HUMAN'
|
|
```
|
|
|
|
3. Configure your project's debug profiles (create `.vimspector.json`)
|
|
|
|
Alternatively, you can clone the repo and select which gadgets are installed:
|
|
|
|
1. Check the dependencies
|
|
1. Install the plugin as a Vim package. See `:help packages`.
|
|
2. Add `packadd! vimspector` to you `.vimrc`
|
|
2. Install some 'gadgets' (debug adapters) - see `:VimspectorInstall ...`
|
|
3. Configure your project's debug profiles (create `.vimspector.json`)
|
|
|
|
If you prefer to use a plugin manager, see the plugin manager's docs. For
|
|
Vundle, use:
|
|
|
|
```vim
|
|
Plugin 'puremourning/vimspector'
|
|
```
|
|
|
|
The following sections expand on the above brief overview.
|
|
|
|
## Dependencies
|
|
|
|
Vimspector requires:
|
|
|
|
* One of:
|
|
* Vim 8.2 Huge build compiled with Python 3.6 or later
|
|
* Neovim 0.4.3 with Python 3.6 or later (experimental)
|
|
* One of the following operating systems:
|
|
* Linux
|
|
* macOS Mojave or later
|
|
* Windows (experimental)
|
|
|
|
Why such a new vim ? Well 2 reasons:
|
|
|
|
1. Because vimspector uses a lot of new Vim features
|
|
2. Because there are Vim bugs that vimspector triggers that will frustrate you
|
|
if you hit them.
|
|
|
|
Why is neovim experimental? Because the author doesn't use neovim regularly, and
|
|
there are no regression tests for vimspector in neovim, so it's likely to break
|
|
frequently. Issue reports are handled on best-efforts basis, and PRs are
|
|
welcome to fix bugs. See also the next section descibing differences for neovim
|
|
vs vim.
|
|
|
|
Why Windows support experimental? Because it's effort and it's not a priority
|
|
for the author. PRs are welcome to fix bugs. Windows will not be regularly
|
|
tested.
|
|
|
|
Which Linux versions? I only test on Ubuntu 18.04 and later and RHEL 7.
|
|
|
|
## Neovim differences
|
|
|
|
neovim doesn't implement some features Vimspector relies on:
|
|
|
|
* WinBar - used for the buttons at the top of the code window and for changing
|
|
the output window's current output.
|
|
* Prompt Buffers - used to send commands in the Console and add Watches.
|
|
(*Note*: prompt buffers are available in neovim nightly)
|
|
* Balloons - used to display the values of variables when debugging.
|
|
|
|
Workarounds are in place as follows:
|
|
|
|
* WinBar - There are [mappings](#mappings),
|
|
[`:VimspectorShowOutput`](#program-output) and
|
|
[`:VimspectorReset`](#closing-debugger)
|
|
* Prompt Buffers - There are [`:VimspectorEval`](#console)
|
|
and [`:VimspectorWatch`](#watches)
|
|
|
|
There is no workaroud for the lack of balloons; you'll just have to use
|
|
`:VimspectorEval` or `:VimspectorWatch`, or switch to Vim.
|
|
|
|
## Windows differences
|
|
|
|
The following features are not implemented for Windows:
|
|
|
|
* Tailing the vimspector log in the Output Window.
|
|
|
|
## Trying it out
|
|
|
|
If you just want to try out vimspector without changing your vim config, there
|
|
are example projects for a number of languages in `support/test`, including:
|
|
|
|
* Python (`support/test/python/simple_python`)
|
|
* Go (`support/test/go/hello_world`)
|
|
* Nodejs (`support/test/node/simple`)
|
|
* Chrome (`support/test/chrome/`)
|
|
* etc.
|
|
|
|
To test one of these out, cd to the directory and run:
|
|
|
|
```
|
|
vim -Nu /path/to/vimspector/tests/vimrc --cmd "let g:vimspector_enable_mappings='HUMAN'"
|
|
```
|
|
|
|
Then press `<F5>`.
|
|
|
|
There's also a C++ project in `tests/testdata/cpp/simple/` with a `Makefile`
|
|
which can be used to check everything is working. This is used by the regression
|
|
tests in CI so should always work, and is a good way to check if the problem is
|
|
your configuration rather than a bug.
|
|
|
|
## Cloning the plugin
|
|
|
|
If you're not using a release tarball, you'll need to clone this repo to the
|
|
appropriate place.
|
|
|
|
1. Clone the plugin
|
|
|
|
There are many Vim plugin managers, and I'm not going to state a particular
|
|
preference, so if you choose to use one, follow the plugin manager's
|
|
documentation. For example, for Vundle, use:
|
|
|
|
```viml
|
|
Plugin 'puremourning/vimspector'
|
|
```
|
|
|
|
If you don't use a plugin manager already, install vimspector as a Vim package
|
|
by cloning this repository into your package path, like this:
|
|
|
|
```
|
|
$ git clone https://github.com/puremourning/vimspector ~/.vim/pack/vimspector/opt/vimspector
|
|
```
|
|
|
|
2. Configure vimspector in your `.vimrc`, for example to enable the standard
|
|
mapings:
|
|
|
|
```viml
|
|
let g:vimspector_enable_mappings = 'HUMAN'
|
|
```
|
|
|
|
3. Load vimspector at runtime. This can also be added to your `.vimrc` after
|
|
configuring vimspector:
|
|
|
|
```
|
|
packadd! vimspector
|
|
```
|
|
|
|
See support/doc/example_vimrc.vim for a minimal example.
|
|
|
|
## Install some gadgets
|
|
|
|
Vimspector is a generic client for Debug Adapters. Debug Adapters (referred to
|
|
as 'gadgets' or 'adapters') are what actually do the work of talking to the real
|
|
debugers.
|
|
|
|
In order for Vimspector to be useful, you need to have some adapters installed.
|
|
|
|
There are a few ways to do this:
|
|
|
|
* If you downloaded a tarball, gadgets for main supported langauges are already
|
|
installed for you.
|
|
* Using `:VimspectorInstall <adapter> <args...>` (use TAB `wildmenu` to see the
|
|
options, also accepts any `install_gadget.py` option)
|
|
* Using `python3 install_gadget.py <args>` (use `--help` to see all options)
|
|
* Attempting to launch a debug configuration; if the configured adapter
|
|
can't be found, vimspector will suggest installing one.
|
|
* Using `:VimspectorUpdate` to install the latest supported versions of the
|
|
gadgets.
|
|
|
|
Here's a demo of doing somee installs and an upgrade:
|
|
|
|
[](https://asciinema.org/a/Hfu4ZvuyTZun8THNen9FQbTay)
|
|
|
|
Both `install_gadget.py` and `:VimspectorInstall` do the same set of things,
|
|
though the default behaviours are slightly different. For supported languages,
|
|
they will:
|
|
|
|
* Download the relevant debug adapter at a version that's been tested from the
|
|
internet, either as a 'vsix' (Visusal Studio plugin), or clone from GitHub. If
|
|
you're in a corporate environment and this is a problem, you may need to
|
|
install the gadgets manually.
|
|
* Perform any necessary post-installation actions, such as:
|
|
* Building any binary components
|
|
* Ensuring scripts are executable, because the VSIX pacakges are usually
|
|
broken in this regard.
|
|
* Set up the `gadgetDir` symlinks for the platform.
|
|
|
|
For example, to install the tested debug adapter for a language, run:
|
|
|
|
| To install | Script | Command |
|
|
| --- | --- | --- |
|
|
| `<adapter>` | | `:VimspectorInstall <adapter>` |
|
|
| `<adapter1>`, `<adapter2>`, ... | | `:VimspectorInstall <adapter1> <adapter2> ...` |
|
|
| `<language>` | `./install_gadget.py --enable-<language> ...` | `:VimspectorInstall --enable-<language> ...` |
|
|
| Supported adapters | `./install_gadget.py --all` | `:VimspectorInstall --all` |
|
|
| Supported adapters, but not TCL | `./install_gadget.py --all --disable-tcl` | `:VimspectorInstall --all --disable-tcl` |
|
|
| Supported and experimental adapters | `./install_gadget.py --all --force-all` | `:VimspectorInstall --all` |
|
|
| Adapter for specific debug config | | Suggested by Vimspector when starting debugging |
|
|
|
|
### VimspectorInstall and VimspectorUpdate commands
|
|
|
|
`:VimspectorInstall` runs `install_gadget.py` in the background with some of
|
|
the options defaulted.
|
|
|
|
`:VimspectorUpdate` runs `install_gadget.py` to re-install (i.e. update) any
|
|
gadgets already installed in your `.gadgets.json`.
|
|
|
|
The output is minimal, to see the full output add `--verbose` to the command, as
|
|
in `:VimspectorInstall --verbose ...` or `:VimspectorUpdate --verbose ...`.
|
|
|
|
If the installation is successful, the output window is closed (and the output
|
|
lost forever). Use a `!` to keep it open (e.g. `:VimspectorInstall! --verbose
|
|
--all` or `:VimspectorUpdate!` (etc.).
|
|
|
|
If you know in advance which gadgets you want to install, for example so that
|
|
you can reproduce your config from source control, you can set
|
|
`g:vimspector_install_gadgets` to a list of gadgets. This will be used when:
|
|
|
|
* Running `:VimspectorInstall` with no arguments, or
|
|
* Running `:VimspectorUpdate`
|
|
|
|
For example:
|
|
|
|
```viml
|
|
let g:vimspector_install_gadgets = [ 'debugpy', 'vscode-cpptools', 'CodeLLDB' ]
|
|
```
|
|
|
|
### install\_gadget.py
|
|
|
|
By default `install_gadget.py` will overwrite your `.gadgets.json` with the set
|
|
of adapters just installed, whereas `:VimspectorInstall` will _update_ it,
|
|
overwriting only newly changed or installed adapters.
|
|
|
|
If you want to just add a new adapter using the script without destroying the
|
|
existing ones, add `--update-gadget-config`, as in:
|
|
|
|
```bash
|
|
$ ./install_gadget.py --enable-tcl
|
|
$ ./install_gadget.py --enable-rust --update-gadget-config
|
|
$ ./install_gadget.py --enable-java --update-gadget-config
|
|
```
|
|
|
|
If you want to maintain `configurations` outside of the vimspector repository
|
|
(this can be useful if you have custom gadgets or global configurations),
|
|
you can tell the installer to use a different basedir, then set
|
|
`g:vimspector_base_dir` to point to that directory, for example:
|
|
|
|
```bash
|
|
$ ./install_gadget.py --basedir $HOME/.vim/vimspector-config --all --force-all
|
|
```
|
|
|
|
Then add this to your `.vimrc`:
|
|
|
|
```viml
|
|
let g:vimspector_base_dir=expand( '$HOME/.vim/vimspector-config' )
|
|
```
|
|
|
|
When usnig `:VimspectorInstall`, the `g:vimspector_base_dir` setting is
|
|
respected unless `--basedir` is manually added (not recommended).
|
|
|
|
See `--help` for more info on the various options.
|
|
|
|
## Manual gadget installation
|
|
|
|
If the language you want to debug is not in the supported list above, you can
|
|
probably still make it work, but it's more effort.
|
|
|
|
You essentially need to get a working installation of the debug adapter, find
|
|
out how to start it, and configure that in an `adapters` entry in either your
|
|
`.vimspector.json` or in `.gadgets.json`.
|
|
|
|
The simplest way in practice is to install or start Visusal Studio Code and use
|
|
its extension manager to install the relevant extension. You can then configure
|
|
the adapter manually in the `adapters` section of your `.vimspector.json` or in
|
|
a `gadgets.json`.
|
|
|
|
PRs are always welcome to add supported languages (which roughly translates to
|
|
updating `python/vimspector/gadgets.py` and testing it).
|
|
|
|
|
|
### The gadget directory
|
|
|
|
Vimspector uses the following directory by default to look for a file named
|
|
`.gadgets.json`: `</path/to/vimspector>/gadgets/<os>`.
|
|
|
|
This path is exposed as the vimspector _variable_ `${gadgetDir}`. This is useful
|
|
for configuring gadget command lines.
|
|
|
|
Where os is one of:
|
|
|
|
* `macos`
|
|
* `linux`
|
|
* `windows` (though note: Windows is not supported)
|
|
|
|
The format is the same as `.vimspector.json`, but only the `adapters` key is
|
|
used:
|
|
|
|
Example:
|
|
|
|
```json
|
|
{
|
|
"adapters": {
|
|
"lldb-vscode": {
|
|
"variables": {
|
|
"LLVM": {
|
|
"shell": "brew --prefix llvm"
|
|
}
|
|
},
|
|
"attach": {
|
|
"pidProperty": "pid",
|
|
"pidSelect": "ask"
|
|
},
|
|
"command": [
|
|
"${LLVM}/bin/lldb-vscode"
|
|
],
|
|
"env": {
|
|
"LLDB_LAUNCH_FLAG_LAUNCH_IN_TTY": "YES"
|
|
},
|
|
"name": "lldb"
|
|
},
|
|
"vscode-cpptools": {
|
|
"attach": {
|
|
"pidProperty": "processId",
|
|
"pidSelect": "ask"
|
|
},
|
|
"command": [
|
|
"${gadgetDir}/vscode-cpptools/debugAdapters/OpenDebugAD7"
|
|
],
|
|
"name": "cppdbg"
|
|
},
|
|
"vscode-python": {
|
|
"command": [
|
|
"node",
|
|
"${gadgetDir}/vscode-python/out/client/debugger/debugAdapter/main.js"
|
|
],
|
|
"name": "vscode-python"
|
|
}
|
|
}
|
|
}
|
|
```
|
|
|
|
The gadget file is automatically written by `install_gadget.py` (or
|
|
`:VimspectorInstall`).
|
|
|
|
Vimspector will also load any fies matching:
|
|
`</path/to/vimspector>/gadgets/<os>/.gadgets.d/*.json`. These have the same
|
|
format as `.gadgets.json` but are not overwritten when running
|
|
`install_gadget.py`.
|
|
|
|
## Upgrade
|
|
|
|
After updating the Vimspector code (either via `git pull` or whatever package
|
|
manager), run `:VimspectorUpdate` to update any already-installed gadets.
|
|
|
|
# About
|
|
|
|
## Background
|
|
|
|
The motivation is that debugging in Vim is a pretty horrible experience,
|
|
particularly if you use multiple languages. With pyclewn no more and the
|
|
built-in termdebug plugin limited to gdb, I wanted to explore options.
|
|
|
|
While Language Server Protocol is well known, the Debug Adapter Protocol is less
|
|
well known, but achieves a similar goal: language agnostic API abstracting
|
|
debuggers from clients.
|
|
|
|
The aim of this project is to provide a simple but effective debugging
|
|
experience in Vim for multiple languages, by leveraging the debug adapters that
|
|
are being built for Visual Studio Code.
|
|
|
|
The ability to do remote debugging is a must. This is key to my workflow, so
|
|
baking it in to the debugging experience is a top bill goal for the project. So
|
|
vimspector has first-class support for executing programs remotely and attaching
|
|
to them. This support is unique to vimspector and on top of (complementary to)
|
|
any such support in actual debug adapters.
|
|
|
|
## Status
|
|
|
|
Vimspector is a work in progress, and any feedback/contributions are more
|
|
than welcome.
|
|
|
|
The backlog can be [viewed on Trello](https://trello.com/b/yvAKK0rD/vimspector).
|
|
|
|
### Experimental
|
|
|
|
The plugin is currently _experimental_. That means that any part of it
|
|
can (and probably will) change, including things like:
|
|
|
|
- breaking changes to the configuration
|
|
- keys, layout, functionatlity of the UI
|
|
|
|
However, I commit to only doing this in the most extreme cases and to annouce
|
|
such changes on Gitter well in advance. There's nothing more annoying than stuff
|
|
just breaking on you. I get that.
|
|
|
|
# Mappings
|
|
|
|
By default, vimspector does not change any of your mappings. Mappings are very
|
|
personal and so you should work out what you like and use vim's powerful mapping
|
|
features to set your own mappings. To that end, Vimspector defines the following
|
|
`<Plug>` mappings:
|
|
|
|
* `<Plug>VimspectorContinue`
|
|
* `<Plug>VimspectorStop`
|
|
* `<Plug>VimspectorRestart`
|
|
* `<Plug>VimspectorPause`
|
|
* `<Plug>VimspectorToggleBreakpoint`
|
|
* `<Plug>VimspectorToggleConditionalBreakpoint`
|
|
* `<Plug>VimspectorAddFunctionBreakpoint`
|
|
* `<Plug>VimspectorStepOver`
|
|
* `<Plug>VimspectorStepInto`
|
|
* `<Plug>VimspectorStepOut`
|
|
* `<Plug>VimspectorRunToCursor`
|
|
|
|
These map roughly 1-1 with the API functions below.
|
|
|
|
For example, if you want `<F5>` to start/continue debugging, add this to some
|
|
appropriate place, such as your `vimrc` (hint: run `:e $MYVIMRC`).
|
|
|
|
```viml
|
|
nmap <F5> <Plug>VimspectorContinue
|
|
```
|
|
|
|
That said, many people are familiar with particular debuggers, so the following
|
|
mappings can be enabled by setting `g:vimspector_enable_mappings` to the
|
|
specified value.
|
|
|
|
Please note: Currently there are no `<plug>` mappings. These will be added in
|
|
future to make custom mappings much easier.
|
|
|
|
## Visual Studio / VSCode
|
|
|
|
To use Visual Studio-like mappings, add the following to your `vimrc` **before
|
|
loading vimspector**:
|
|
|
|
```viml
|
|
let g:vimspector_enable_mappings = 'VISUAL_STUDIO'
|
|
```
|
|
|
|
| Key | Function | API |
|
|
| --- | --- | --- |
|
|
| `F5` | When debugging, continue. Otherwise start debugging. | `vimspector#Continue()` |
|
|
| `Shift F5` | Stop debugging. | `vimspector#Stop()` |
|
|
| `Ctrl Shift F5` | Restart debugging with the same configuration. | `vimspector#Restart()` |
|
|
| `F6` | Pause debugee. | `vimspector#Pause()` |
|
|
| `F9` | Toggle line breakpoint on the current line. | `vimspector#ToggleBreakpoint()` |
|
|
| `Shift F9` | Add a function breakpoint for the expression under cursor | `vimspector#AddFunctionBreakpoint( '<cexpr>' )` |
|
|
| `F10` | Step Over | `vimspector#StepOver()` |
|
|
| `F11` | Step Into | `vimspector#StepInto()` |
|
|
| `Shift F11` | Step out of current function scope | `vimspector#StepOut()` |
|
|
|
|
## Human Mode
|
|
|
|
If, like me, you only have 2 hands and 10 fingers, you probably don't like
|
|
Ctrl-Shift-F keys. Also, if you're running in a terminal, there's a real
|
|
possibility of terminfo being wrong for shifted-F-keys, particularly if your
|
|
`TERM` is `screen-256color`. If these issues (number of hands, `TERM` variables)
|
|
are unfixable, try the following mappings, by adding the following **before
|
|
loading vimspector**:
|
|
|
|
```viml
|
|
let g:vimspector_enable_mappings = 'HUMAN'
|
|
```
|
|
|
|
| Key | Function | API |
|
|
| --- | --- | --- |
|
|
| `F5` | When debugging, continue. Otherwise start debugging. | `vimspector#Continue()` |
|
|
| `F3` | Stop debugging. | `vimspector#Stop()` |
|
|
| `F4` | Restart debugging with the same configuration. | `vimspector#Restart()` |
|
|
| `F6` | Pause debugee. | `vimspector#Pause()` |
|
|
| `F9` | Toggle line breakpoint on the current line. | `vimspector#ToggleBreakpoint()` |
|
|
| `<leader>F9` | Toggle conditional line breakpoint on the current line. | `vimspector#ToggleBreakpoint( { trigger expr, hit count expr } )` |
|
|
| `F8` | Add a function breakpoint for the expression under cursor | `vimspector#AddFunctionBreakpoint( '<cexpr>' )` |
|
|
| `<leader>F8` | Run to Cursor | `vimspector#RunToCursor()` |
|
|
| `F10` | Step Over | `vimspector#StepOver()` |
|
|
| `F11` | Step Into | `vimspector#StepInto()` |
|
|
| `F12` | Step out of current function scope | `vimspector#StepOut()` |
|
|
|
|
# Usage
|
|
|
|
## Launch and attach by PID:
|
|
|
|
* Create `.vimspector.json`. See [below](#supported-languages).
|
|
* `:call vimspector#Launch()` and select a configuration.
|
|
|
|

|
|
|
|
### Launch with options
|
|
|
|
To launch a specific debug configuration, or specify [replacement
|
|
variables][vimspector-ref-var] for the launch, you can use:
|
|
|
|
* `:call vimspector#LaunchWithSettings( dict )`
|
|
|
|
The argument is a `dict` with the following keys:
|
|
|
|
* `configuration`: (optional) Name of the debug configuration to launch
|
|
* `<anything else>`: (optional) Name of a variable to set
|
|
|
|
This allows for some intergration and automation. For example, if you have a
|
|
configuration named `Run Test` that contains a [replacement
|
|
variable][vimspector-ref-var] named `${Test}` you could write a mapping which
|
|
ultimately executes:
|
|
|
|
```viml
|
|
vimspector#LaunchWithSettings( #{ configuration: 'Run Test'
|
|
\ Test: 'Name of the test' } )
|
|
```
|
|
|
|
This would start the `Run Test` configuration with `${Test}` set to `'Name of
|
|
the test'` and Vimspector would _not_ prompt the user to enter or confirm these
|
|
things.
|
|
|
|
See [our YouCompleteMe integration guide](#usage-with-youcompleteme) for
|
|
another example where it can be used to specify the port to connect the [java
|
|
debugger](#java---partially-supported)
|
|
|
|
### Debug configuration selection
|
|
|
|
Vimspector uses the following logic to choose a configuration to launch:
|
|
|
|
1. If a configuration was specified in the launch options (as above), use that.
|
|
2. Otherwise if there's only one configuration and it doesn't have `autoselect`
|
|
set to `false`, use that.
|
|
3. Otherwise if there's exactly one configuration with `default` set to `true`
|
|
and without `autoselect` set to `false`, use that.
|
|
4. Otherwise, prompt the user to select a configuration.
|
|
|
|
See [the reference guide][vimspector-ref-config-selection] for details.
|
|
|
|
|
|
### Get configurations
|
|
|
|
* Use `vimspector#GetConfigurations()` to get a list of configurations
|
|
|
|
For example, to get an array of configurations and fuzzy matching on the result
|
|
```viml
|
|
:call matchfuzzy(vimspector#GetConfigurations(), "test::case_1")
|
|
```
|
|
|
|
## Breakpoints
|
|
|
|
* Use `vimspector#ToggleBreakpoint([ { 'condition': '<condition expr>' } ])`
|
|
to set/disable/delete a line breakpoint, with optional condition.
|
|
* Use `vimspector#AddFunctionBreakpoint( '<name>' [, { 'condition': '<condition expr>' } ] )`
|
|
to add a function breakpoint with optional condition.
|
|
|
|
Both of these functions take a single optional argument which is a dictionary of
|
|
options. The dictionary can have the following keys:
|
|
|
|
* `condition`: An optional expression evaluated to deterimie if the breakpoint
|
|
should fire. Not supported by all debug adapters. For example, to break when
|
|
`abc` is `10`, enter something like `abc == 10`, depending on the language.
|
|
* `hitCondition`: An optional expression evaluated to determine a number of
|
|
times the breakpoint should be ignored. Should (probablty?) not be used in
|
|
combination with `condition`. Not supported by all debug adapters. For
|
|
example, to break on the 3rd time hitting this line, enter `3`.
|
|
|
|
In both cases, the expression is evaluated by the debugger, so should be in
|
|
whatever dialect the debugger understands when evaluating expressions.
|
|
|
|
When using the `<leader><F9>` mapping, the user is prompted to enter these
|
|
expressions in a command line (with history).
|
|
|
|
### Exception breakpoints
|
|
|
|
When starting debugging, you may be asekd a few questions about how to handle
|
|
exceptoins. These are "exception breakpoints" and vimspector remembers your
|
|
choices while Vim is still running.
|
|
|
|
Typically you can accept the defaults (just keep pressing `<CR>`!) as most debug
|
|
adapter defaults are sane, but if you want to break on, say `uncaught exception`
|
|
then answer `Y` to that (for example).
|
|
|
|
You can configure your choices in the `.vimspector.json`. See
|
|
[the configuration guide][vimspector-ref-exception] for details on that.
|
|
|
|
### Clear breakpoints
|
|
|
|
* Use `vimspector#ClearBreakpoints()`
|
|
to clear all breakpoints including the memory of exception breakpoint choices.
|
|
|
|
### Run to Cursor
|
|
|
|
* Use `vimspector#RunToCursor` or `<leader><F8>`: this creates a temporary
|
|
breakpoint on the current line, then continues execution, clearing the
|
|
breakpiont when it is hit.
|
|
|
|
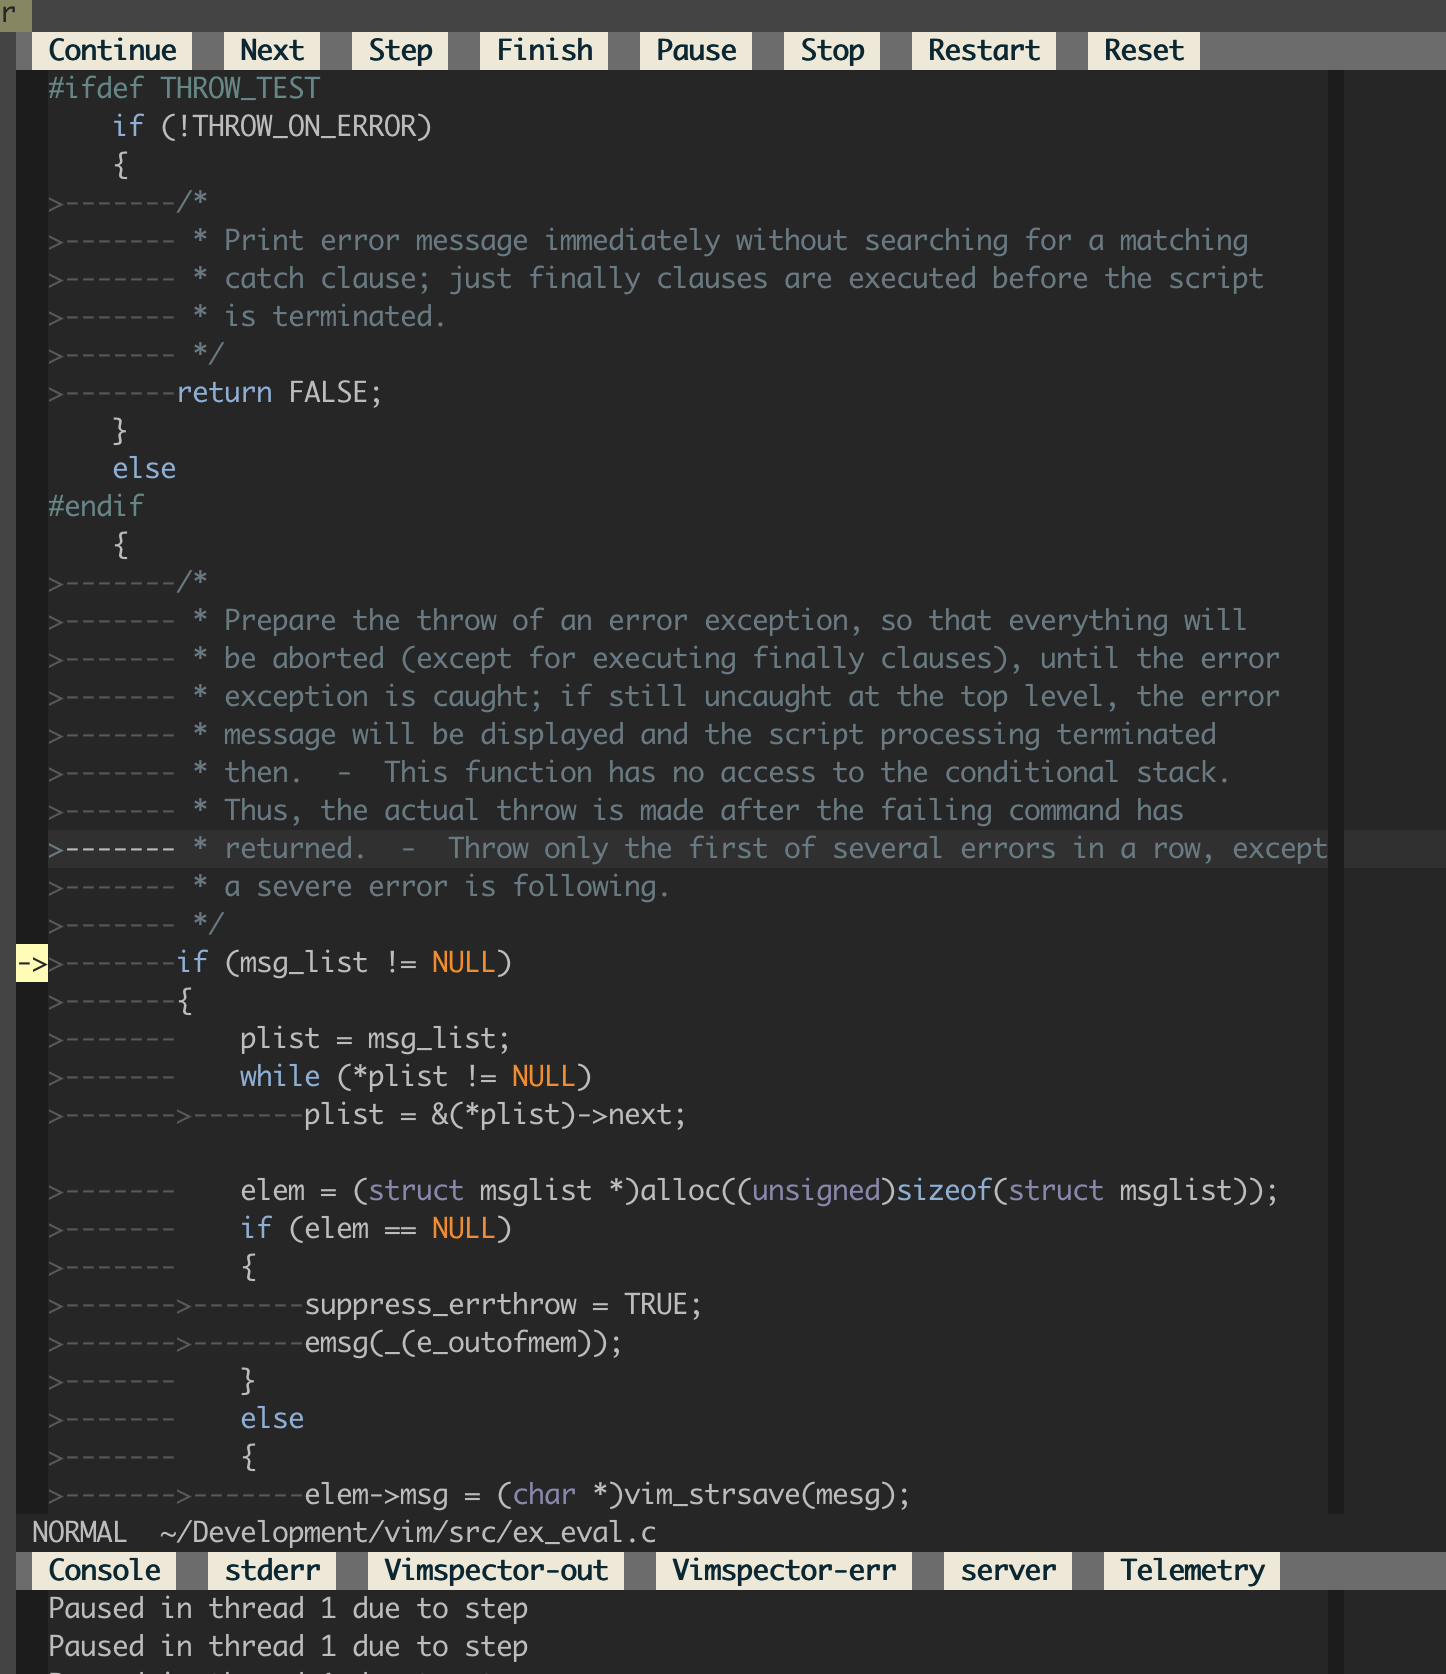
## Stepping
|
|
|
|
* Step in/out, finish, continue, pause etc. using the WinBar, or mappings.
|
|
* If you really want to, the API is `vimspector#StepInto()` etc.
|
|
|
|
|
|
|
|
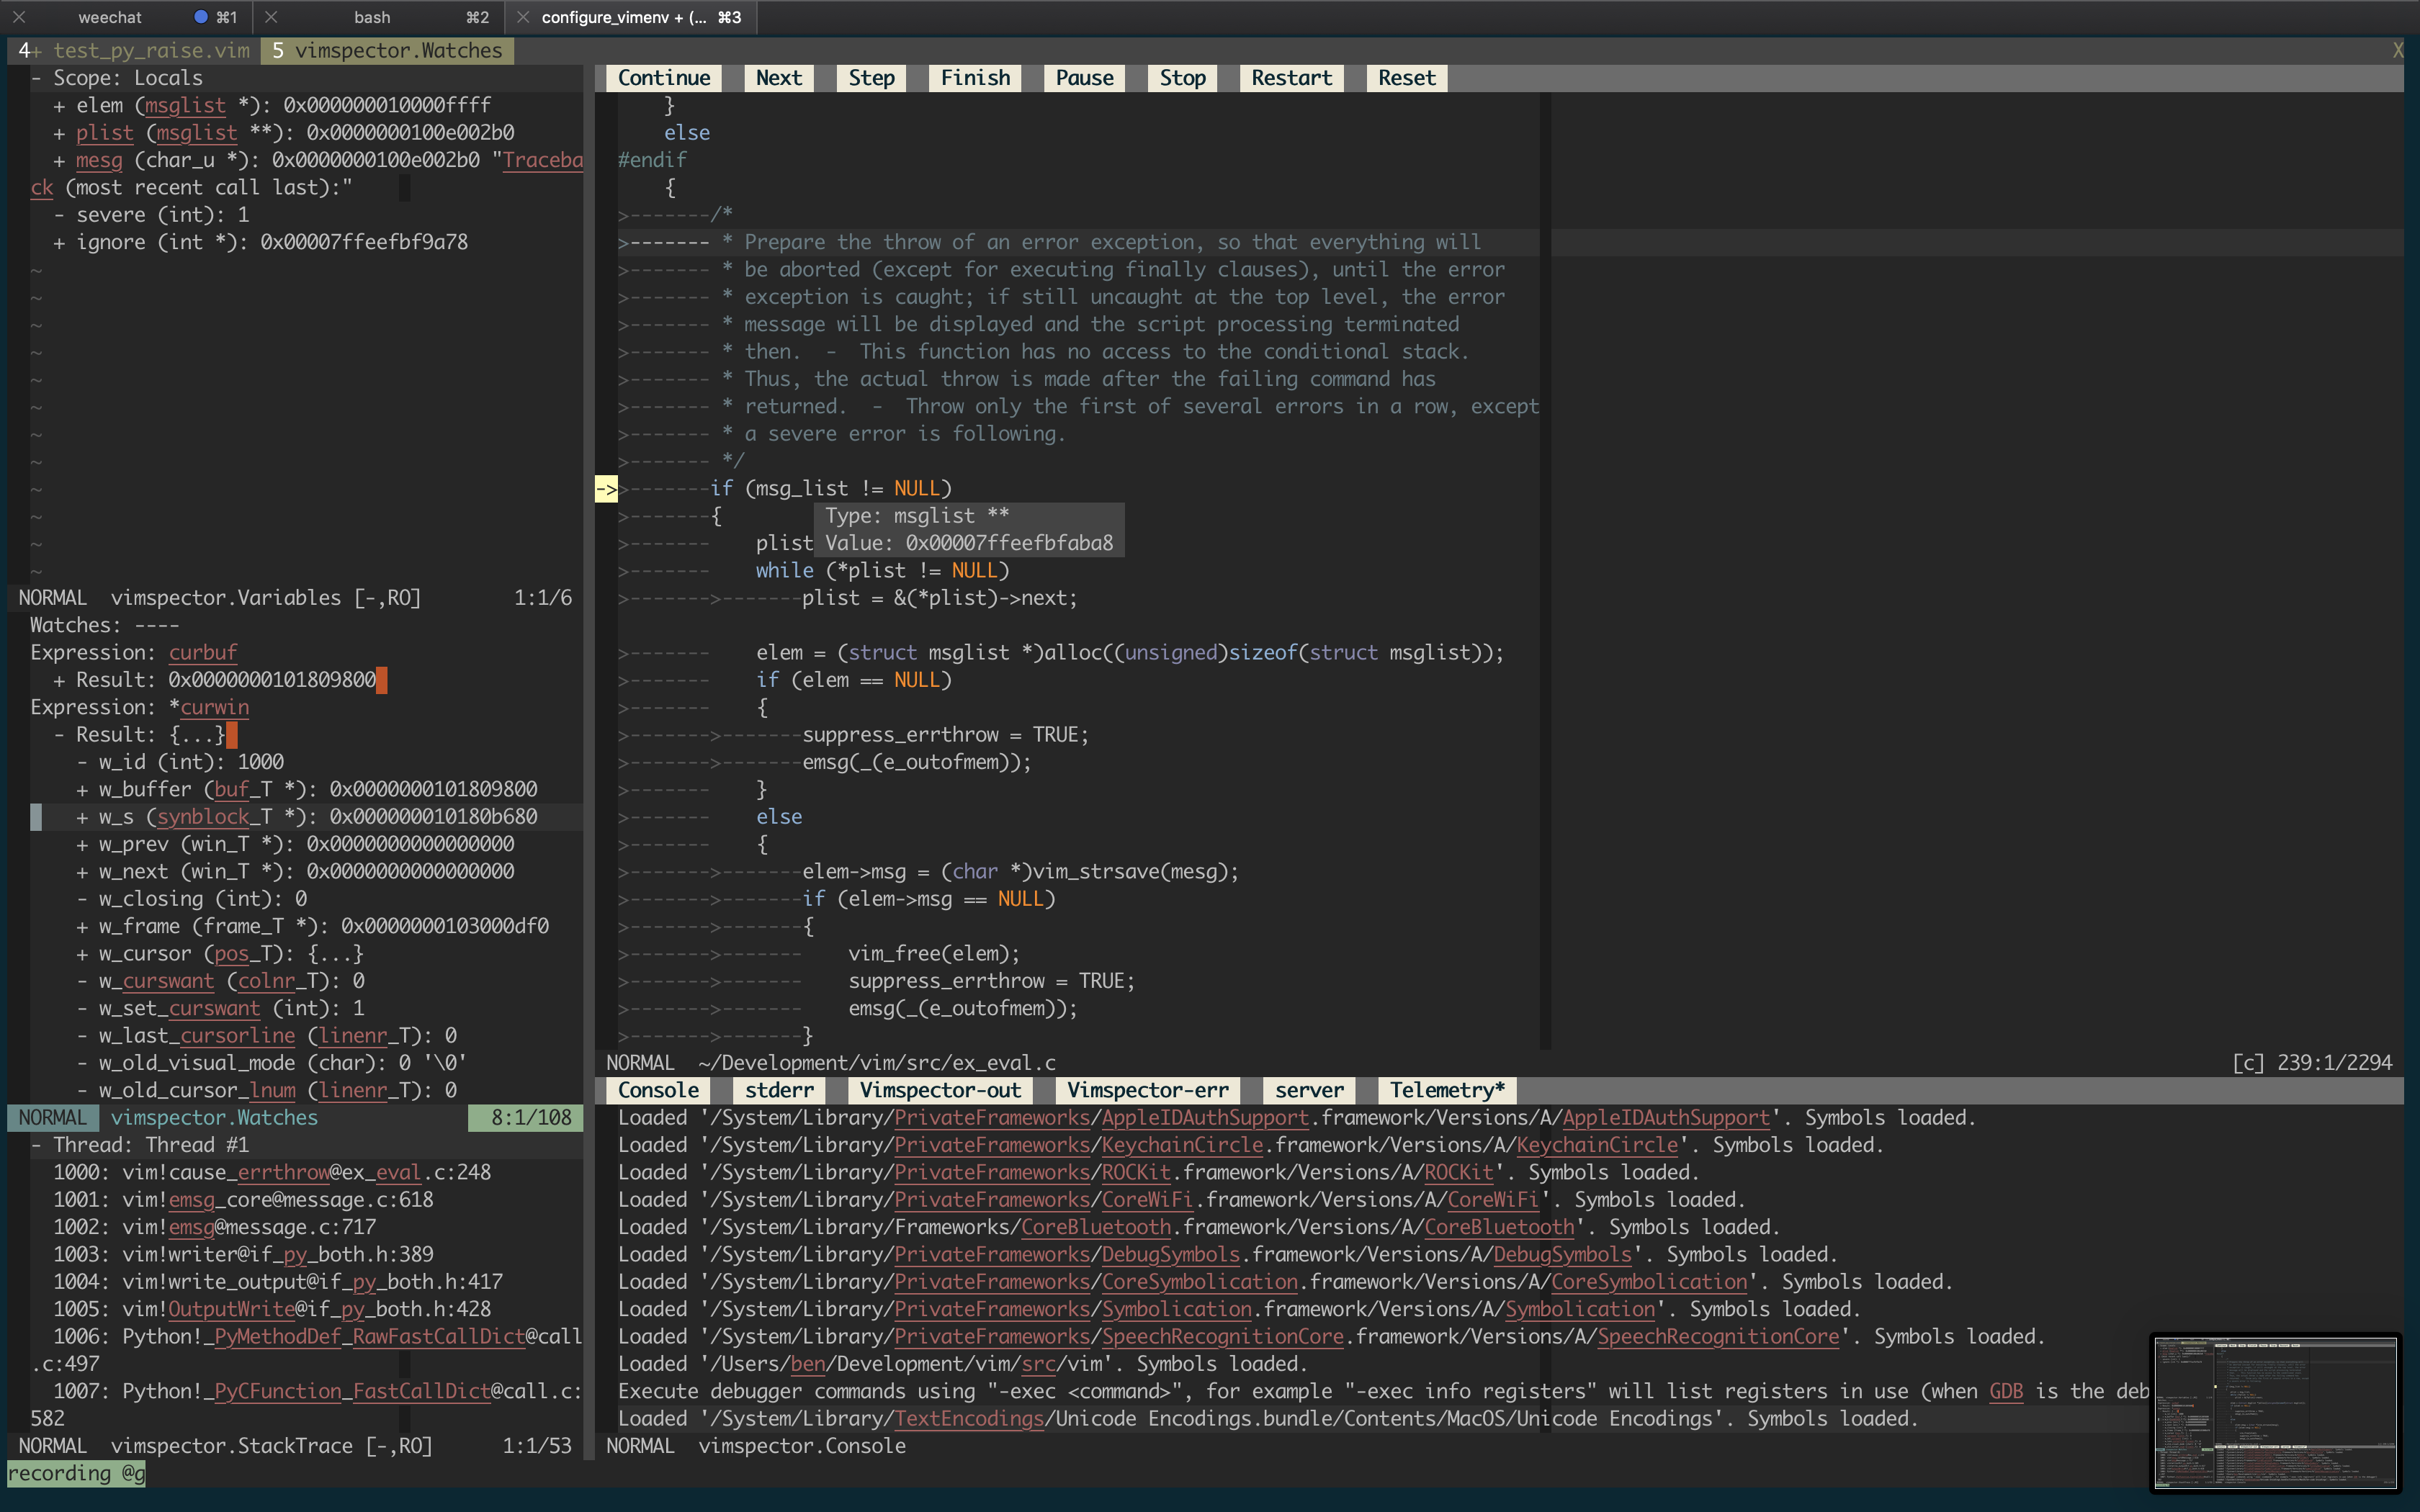
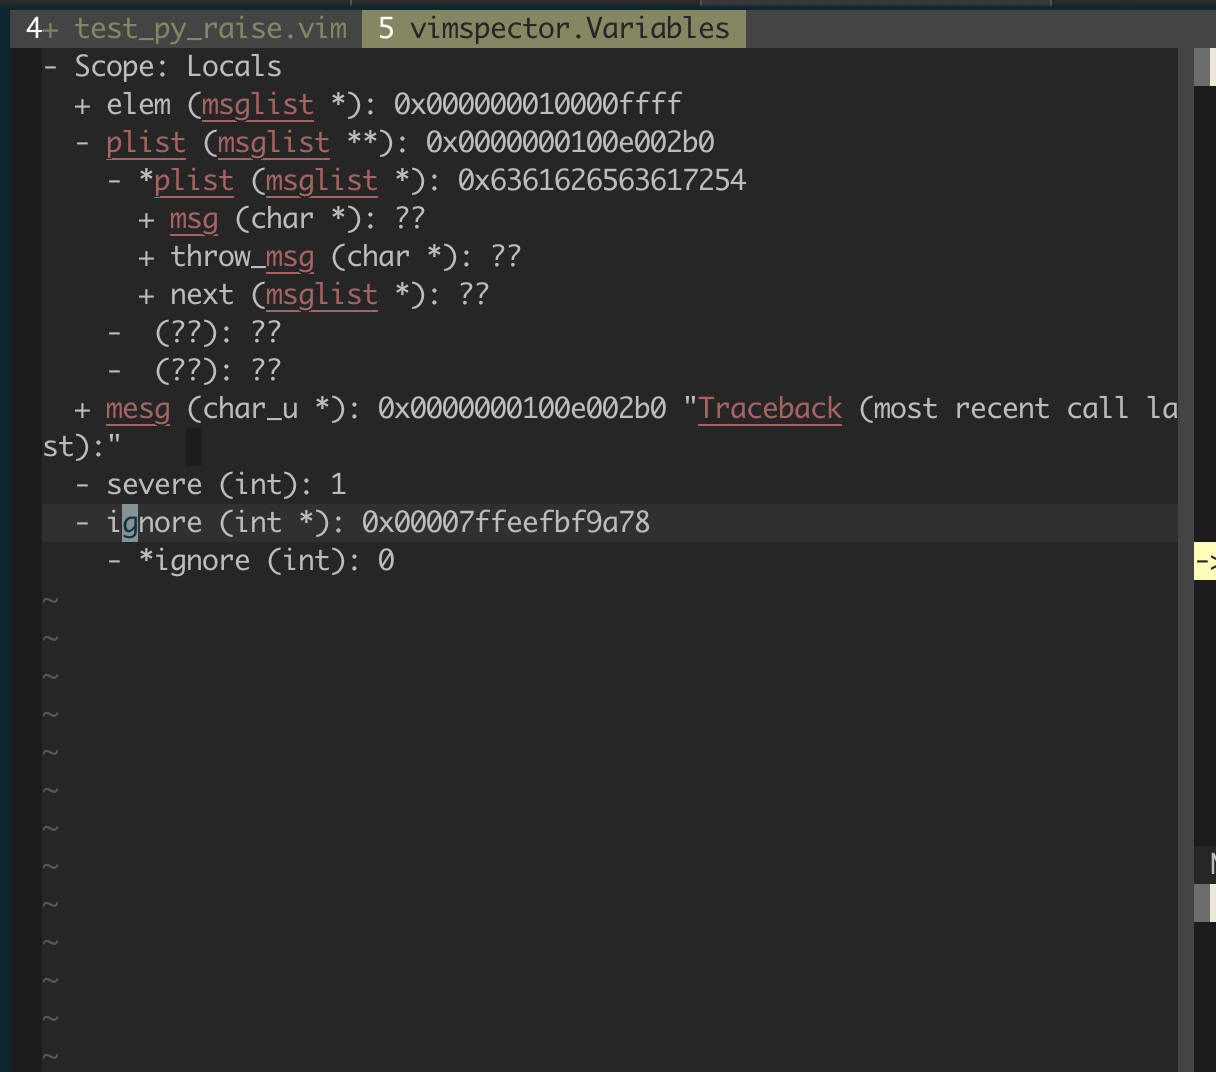
## Variables and scopes
|
|
|
|
* Current scope shows values of locals.
|
|
* Use `<CR>`, or double-click with left mouse to expand/collapse (+, -).
|
|
* When changing the stack frame the locals window updates.
|
|
* While paused, hover to see values
|
|
|
|
|
|
|
|
Scopes and variables are represented by the buffer `vimspector.Variables`.
|
|
|
|
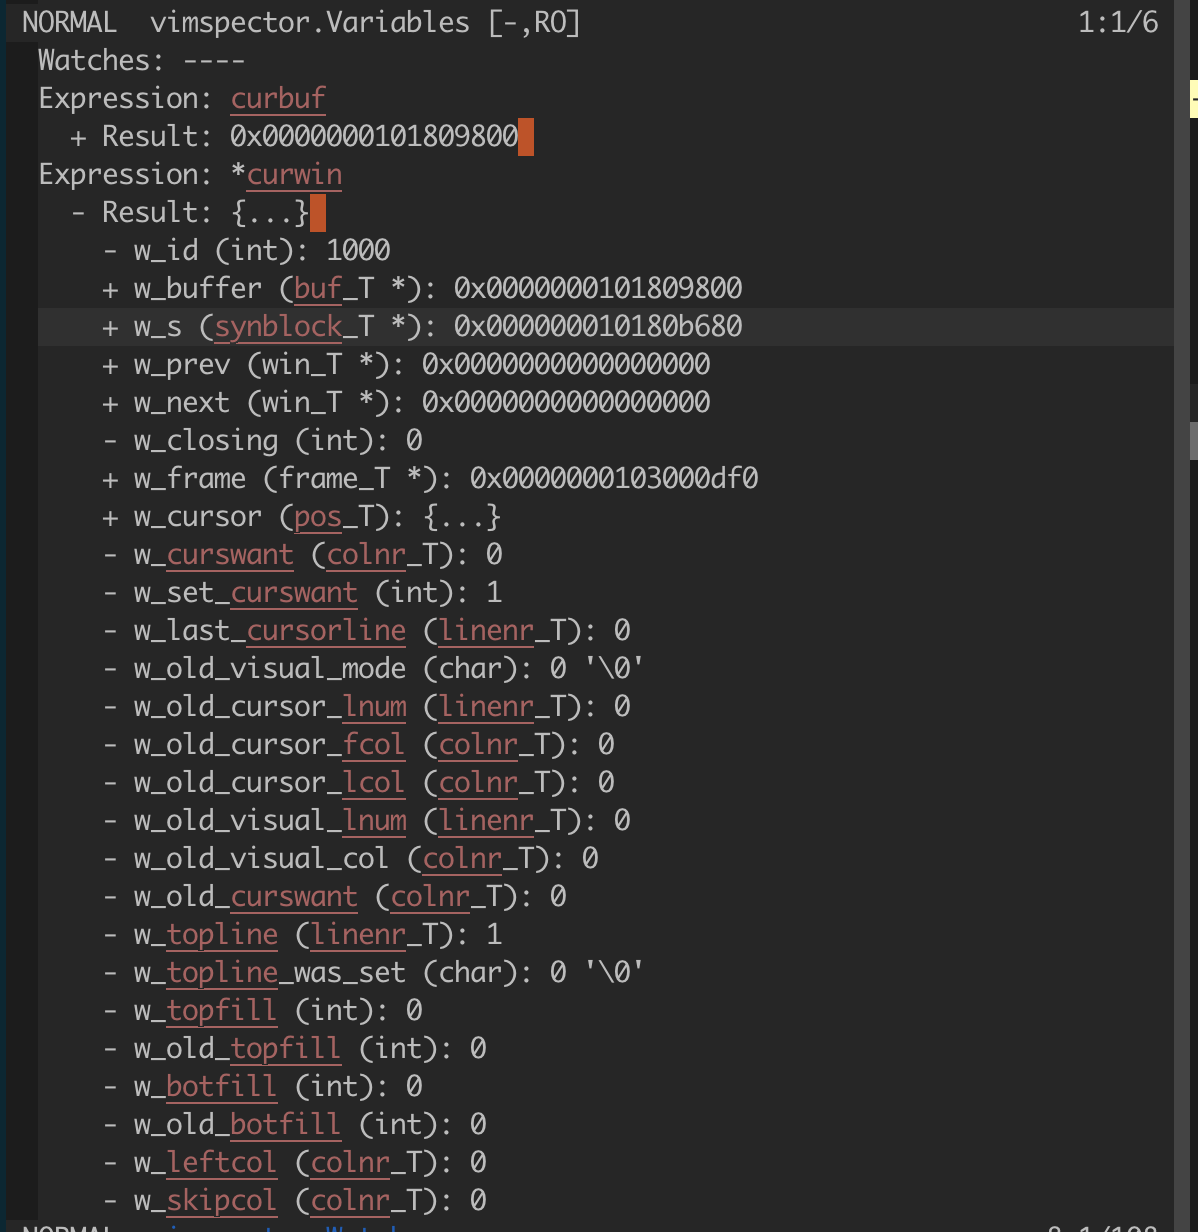
## Watches
|
|
|
|
The watch window is used to inspect variables and expressions. Expressions are
|
|
evaluated in the selected stack frame which is "focussed"
|
|
|
|
The watches window is a prompt buffer, where that's available. Enter insert mode
|
|
to add a new watch expression.
|
|
|
|
* Add watches to the variables window by entering insert mode and
|
|
typing the expression. Commit with `<CR>`.
|
|
* Alternatively, use `:VimspectorWatch <expression>`. Tab-completion for
|
|
expression is available in some debug adapters.
|
|
* Expand result with `<CR>`, or double-click with left mouse.
|
|
* Delete with `<DEL>`.
|
|
|
|
|
|
|
|
The watches are represented by the buffer `vimspector.StackTrace`.
|
|
|
|
### Watch autocompletion
|
|
|
|
The watch prompt buffer has its `omnifunc` set to a function that will
|
|
calcualte completion for the current expression. This is trivailly used with
|
|
`<Ctrl-x><Ctrl-o>` (see `:help ins-completion`), or integrated with your
|
|
favourite completion system. The filetype in the buffer is set to
|
|
`VimspectorPrompt`.
|
|
|
|
For YouCompleteMe, the following config works well:
|
|
|
|
```viml
|
|
let g:ycm_semantic_triggers = {
|
|
\ 'VimspectorPrompt': [ '.', '->', ':', '<' ]
|
|
}
|
|
```
|
|
|
|
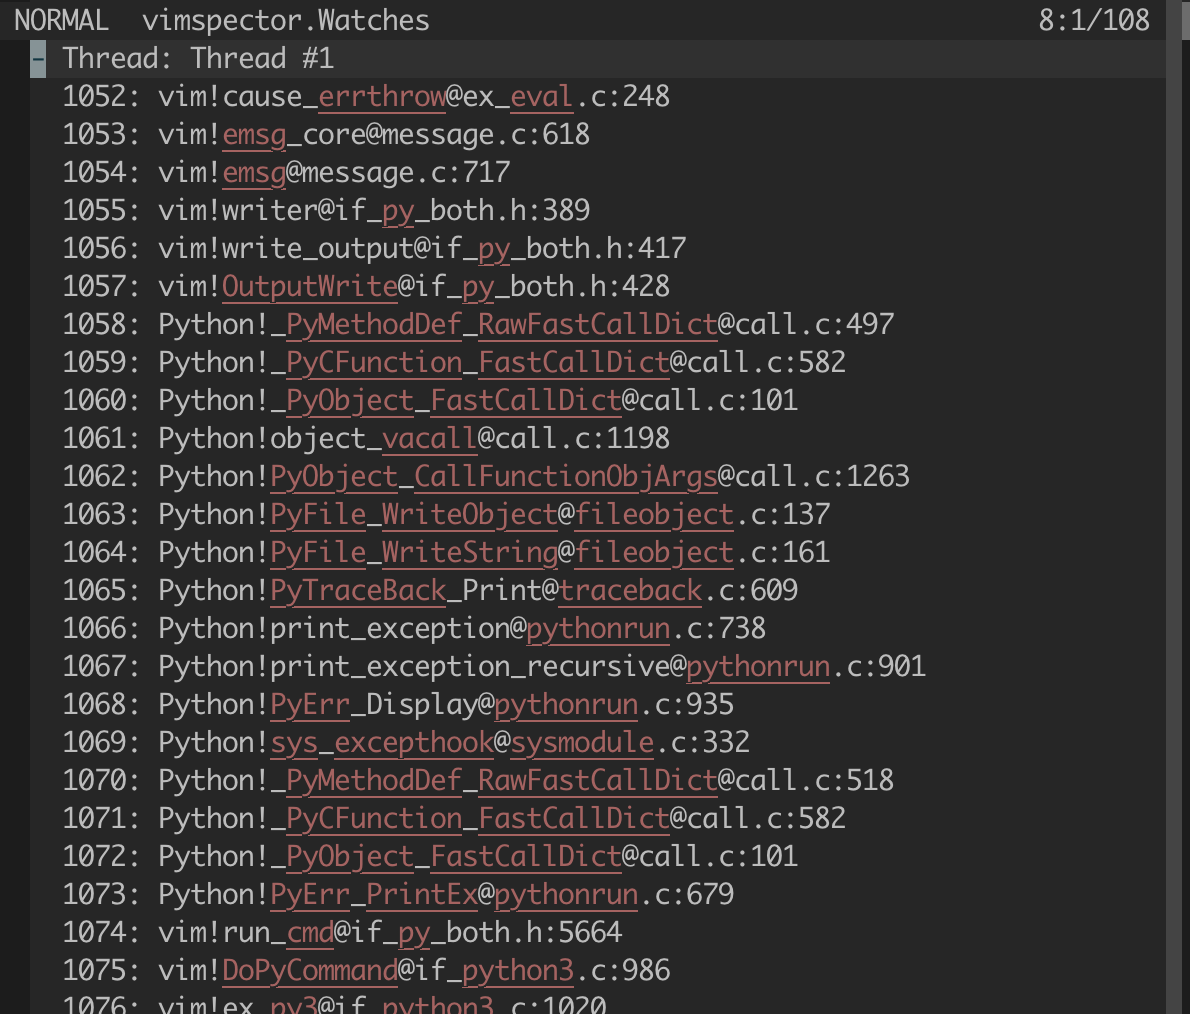
## Stack Traces
|
|
|
|
The stack trace window shows the state of each progream thread. Threads which
|
|
are stopped can be expanded to show the strack trace of that thread.
|
|
|
|
Often, but not always, all threads are stopped when a breakpoint is hit. The
|
|
status of a thread is show in parentheses after the thread's name. Where
|
|
supported by the underlying debugger, threads can be paused and continued
|
|
individually from within the Stack Trace window.
|
|
|
|
A particular thread, highlighted with the `CursorLine` highlight group is the
|
|
"focussed" thread. This is the thread that receives commands like "Stop In",
|
|
"Stop Out", "Continue" and "Pause" in the code window. The focussed thread can
|
|
be changed manually to "switch to" that thread.
|
|
|
|
* Use `<CR>`, or double-click with left mouse to expand/collapse a thread stack
|
|
trace, or use the WinBar button.
|
|
* Use `<CR>`, or double-click with left mouse on a stack frame to jump to it.
|
|
* Use the WinBar or `vimspector#PauseContinueThread()` to individually pause or
|
|
continue the selected thread.
|
|
* Use the "Focus" WinBar button, `<leader><CR>` or `vimspector#SetCurrentThread()`
|
|
to set the "focussed" thread to the currently selected one. If the selected
|
|
line is a stack frame, set the focussed thread to the thread of that frame and
|
|
jump to that frame in the code window.
|
|
|
|
|
|
|
|
The stack trace is represented by the buffer `vimspector.StackTrace`.
|
|
|
|
## Program Output
|
|
|
|
* In the outputs window use the WinBar to select the output channel.
|
|
* Alternatively, use `:VimspectorShowOutput <category>`. Use command-line
|
|
completion to see the categories.
|
|
* The debugee prints to the stdout channel.
|
|
* Other channels may be useful for debugging.
|
|
|
|
|
|
|
|
If the output window is closed, a new one can be opened with
|
|
`:VimspectorShowOutput <category>` (use tab-completion - `wildmenu` to see the
|
|
options).
|
|
|
|
### Console
|
|
|
|
The console window is a prompt buffer, where that's available, and can be used
|
|
as an interactive CLI for the debug adapter. Support for this varies amongt
|
|
adapters.
|
|
|
|
* Enter insert mode to enter a command to evaluate.
|
|
* Alternatively, `:VimspectorEval <expression>`. Completion is available with
|
|
some debug adapters.
|
|
* Commit the request with `<CR>`
|
|
* The request and subsequent result are printed.
|
|
|
|
NOTE: See also [Watches](#watches) above.
|
|
|
|
If the output window is closed, a new one can be opened with
|
|
`:VimspectorShowOutput Console`.
|
|
|
|
### Console autocompletion
|
|
|
|
The console prompt buffer has its `omnifunc` set to a function that will
|
|
calcualte completion for the current command/expression. This is trivailly used
|
|
with `<Ctrl-x><Ctrl-o>` (see `:help ins-completion`), or integrated with your
|
|
favourite completion system. The filetype in the buffer is set to
|
|
`VimspectorPrompt`.
|
|
|
|
For YouCompleteMe, the following config works well:
|
|
|
|
```viml
|
|
let g:ycm_semantic_triggers = {
|
|
\ 'VimspectorPrompt': [ '.', '->', ':', '<' ]
|
|
}
|
|
```
|
|
|
|
### Log View
|
|
|
|
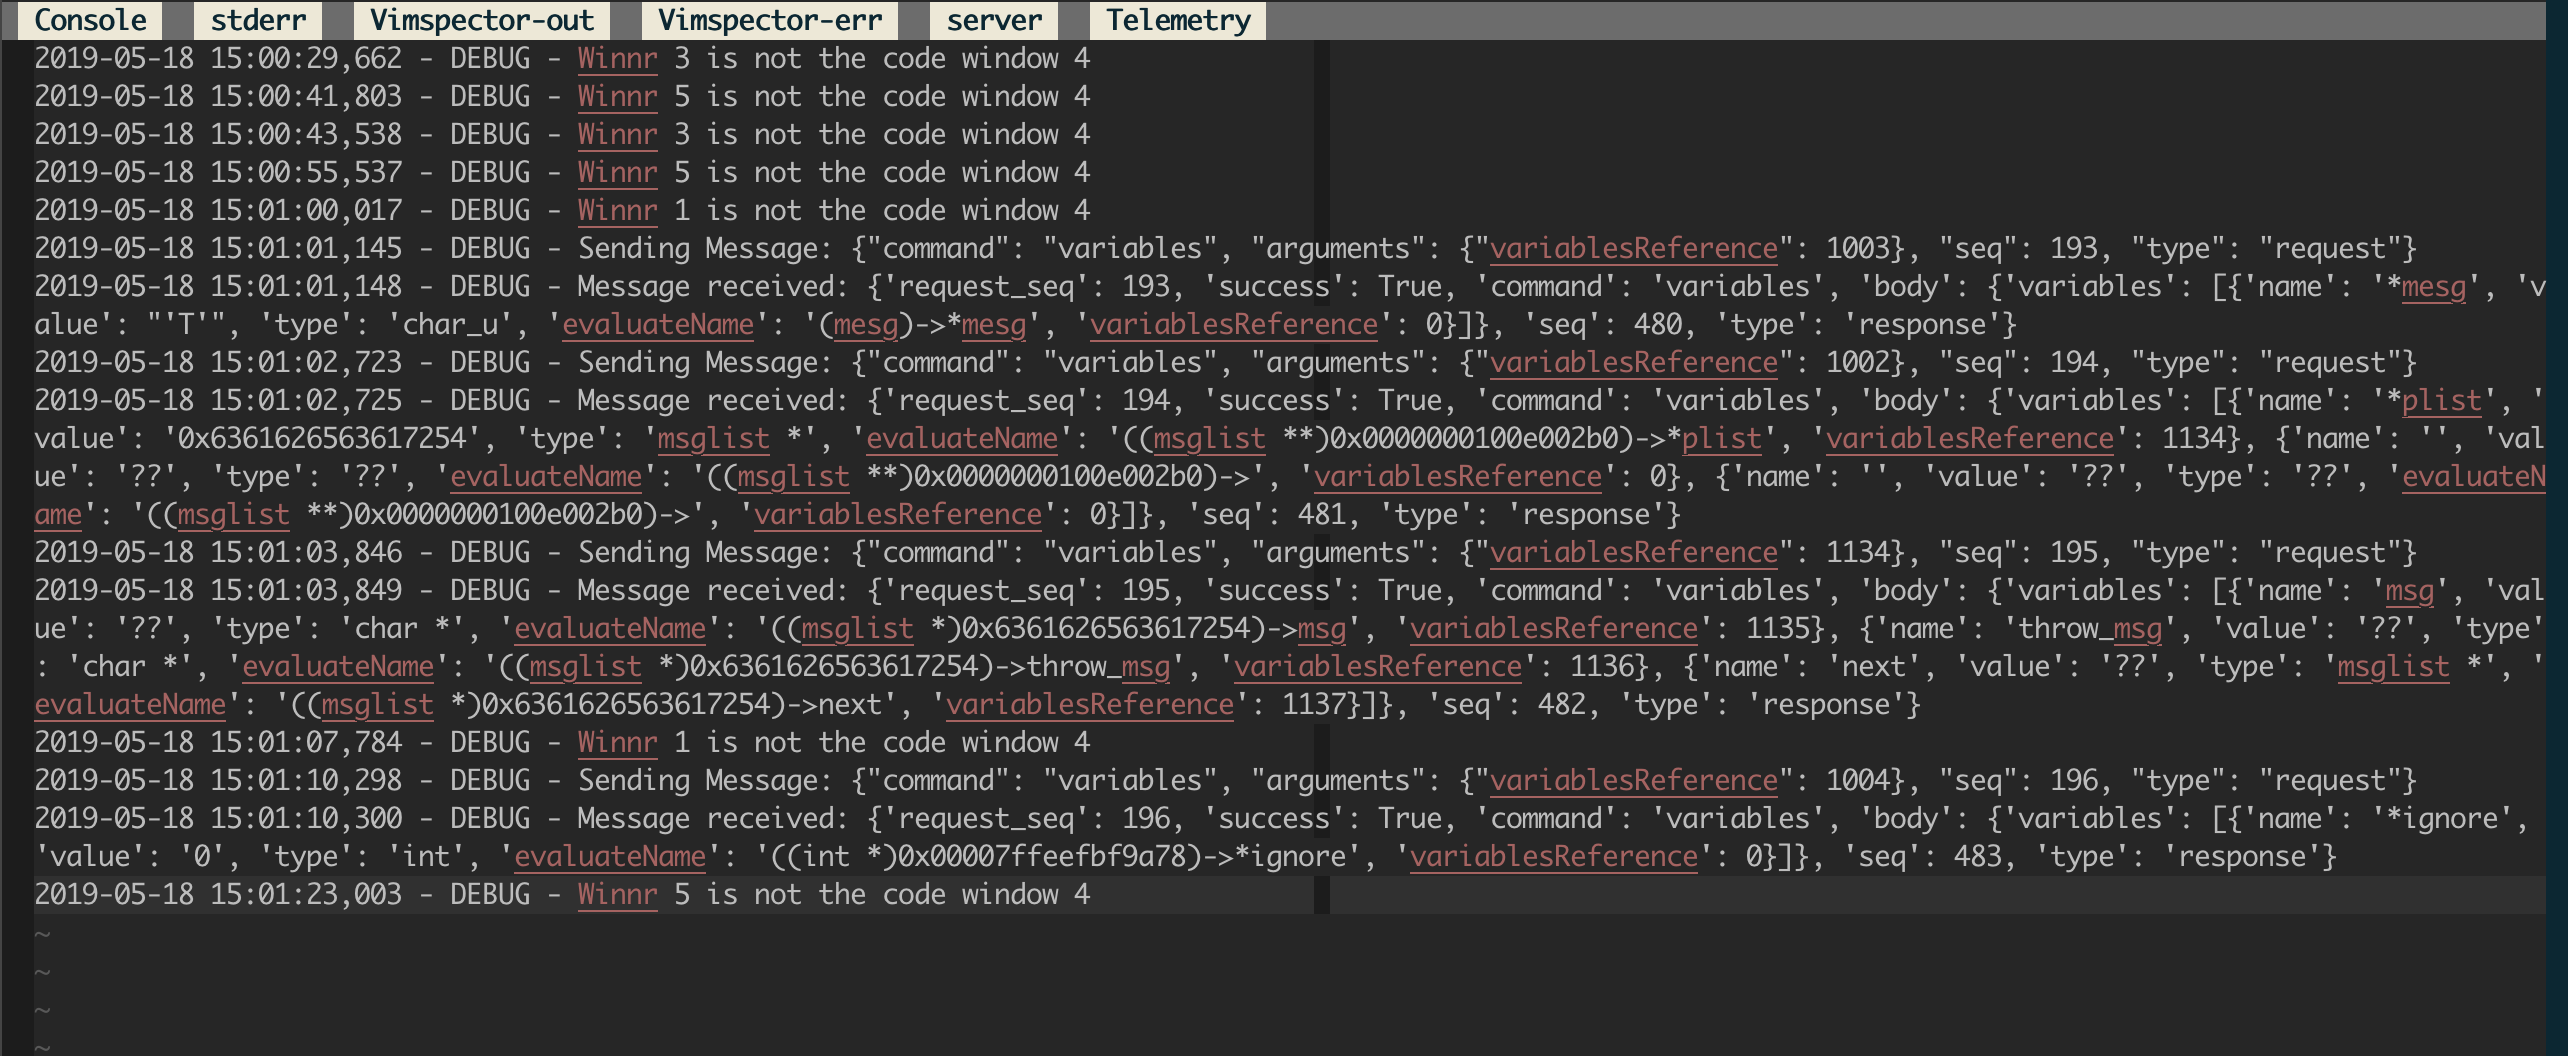
The Vimspector log file contains a full trace of the communication between
|
|
Vimspector and the debug adapter. This is the primary source of diagnostic
|
|
information when something goes wrong that's not a Vim traceback.
|
|
|
|
If you just want to see the Vimspector log file, use `:VimspectorToggleLog`,
|
|
which will tail it in a little window (doesn't work on Windows).
|
|
|
|
## Closing debugger
|
|
|
|
To close the debugger, use:
|
|
|
|
* `Reset` WinBar button (`set mouse=a`)
|
|
* `:VimspectorReset` when the WinBar is not available.
|
|
* `call vimspector#Reset()`
|
|
|
|
# Debug adapter configuration
|
|
|
|
For an introduction to the configuration of `.vimspector.json`, take a look at
|
|
the Getting Started section of the [Vimspector website][website].
|
|
|
|
For full explanation, including how to use variables, substitutions and how to
|
|
specify exception breakpoints, see [the docs][vimspector-ref].
|
|
|
|
The JSON configuration file allows C-style comments:
|
|
|
|
* `// comment to end of line ...`
|
|
* `/* inline comment ... */`
|
|
|
|
Current tested with the following debug adapters.
|
|
|
|
## C, C++, Rust, etc.
|
|
|
|
* [vscode-cpptools](https://github.com/Microsoft/vscode-cpptools)
|
|
* On macOS, I *strongly* recommend using [CodeLLDB](#rust) instead for C and C++
|
|
projects. It's really excellent, has fewer dependencies and doesn't open console
|
|
apps in another Terminal window.
|
|
|
|
|
|
Example `.vimspector.json` (works with both `vscode-cpptools` and `lldb-vscode`.
|
|
For `lldb-vscode` replace the name of the adapter with `lldb-vscode`:
|
|
|
|
* vscode-cpptools Linux/MacOS:
|
|
|
|
```
|
|
{
|
|
"configurations": {
|
|
"Launch": {
|
|
"adapter": "vscode-cpptools",
|
|
"configuration": {
|
|
"request": "launch",
|
|
"program": "<path to binary>",
|
|
"args": [ ... ],
|
|
"cwd": "<working directory>",
|
|
"environment": [ ... ],
|
|
"externalConsole": true,
|
|
"MIMode": "<lldb or gdb>"
|
|
}
|
|
},
|
|
"Attach": {
|
|
"adapter": "vscode-cpptools",
|
|
"configuration": {
|
|
"request": "attach",
|
|
"program": "<path to binary>",
|
|
"MIMode": "<lldb or gdb>"
|
|
}
|
|
}
|
|
...
|
|
}
|
|
}
|
|
```
|
|
|
|
* vscode-cpptools Windows
|
|
|
|
***NOTE FOR WINDOWS USERS:*** You need to install `gdb.exe`. I recommend using
|
|
`scoop install gdb`. Vimspector cannot use the visual studio debugger due to
|
|
licensing.
|
|
|
|
```
|
|
{
|
|
"configurations": {
|
|
"Launch": {
|
|
"adapter": "vscode-cpptools",
|
|
"configuration": {
|
|
"request": "launch",
|
|
"program": "<path to binary>",
|
|
"stopAtEntry": true
|
|
}
|
|
}
|
|
}
|
|
}
|
|
```
|
|
|
|
* CodeLLDB (MacOS)
|
|
|
|
CodeLLDB is superior to vscode-cpptools in a number of ways on macOS at least.
|
|
|
|
See [Rust](#rust).
|
|
|
|
* lldb-vscode (MacOS)
|
|
|
|
An alternative is to to use `lldb-vscode`, which comes with llvm. Here's how:
|
|
|
|
* Install llvm (e.g. with HomeBrew: `brew install llvm`)
|
|
* Create a file named
|
|
`/path/to/vimspector/gadgets/macos/.gadgets.d/lldb-vscode.json`:
|
|
|
|
```json
|
|
{
|
|
"adapters": {
|
|
"lldb-vscode": {
|
|
"variables": {
|
|
"LLVM": {
|
|
"shell": "brew --prefix llvm"
|
|
}
|
|
},
|
|
"attach": {
|
|
"pidProperty": "pid",
|
|
"pidSelect": "ask"
|
|
},
|
|
"command": [
|
|
"${LLVM}/bin/lldb-vscode"
|
|
],
|
|
"env": {
|
|
"LLDB_LAUNCH_FLAG_LAUNCH_IN_TTY": "YES"
|
|
},
|
|
"name": "lldb"
|
|
}
|
|
}
|
|
}
|
|
```
|
|
|
|
## Rust
|
|
|
|
Rust is supported with any gdb/lldb-based debugger. So it works fine with
|
|
`vscode-cpptools` and `lldb-vscode` above. However, support for rust is best in
|
|
[`CodeLLDB`](https://github.com/vadimcn/vscode-lldb#features).
|
|
|
|
* `./install_gadget.py --force-enable-rust` or `:VimspectorInstall CodeLLDB`
|
|
* Example: `support/test/rust/vimspector_test`
|
|
|
|
```json
|
|
{
|
|
"configurations": {
|
|
"launch": {
|
|
"adapter": "CodeLLDB",
|
|
"configuration": {
|
|
"request": "launch",
|
|
"program": "${workspaceRoot}/target/debug/vimspector_test"
|
|
}
|
|
}
|
|
}
|
|
}
|
|
```
|
|
|
|
* Docs: https://github.com/vadimcn/vscode-lldb/blob/master/MANUAL.md
|
|
|
|
|
|
|
|
### Remote debugging
|
|
|
|
The cpptools documentation describes how to attach cpptools to gdbserver using
|
|
`miDebuggerAddress`. Note that when doing this you should use the
|
|
`"request": "attach"`.
|
|
|
|
### Remote launch and attach
|
|
|
|
If you're feeling fancy, checkout the [reference guide][remote-debugging] for
|
|
an example of getting Vimspector to remotely launch and attach.
|
|
|
|
## Python
|
|
|
|
* Python: [debugpy][]
|
|
* Install with `install_gadget.py --enable-python` or `:VimspectorInstall
|
|
debugpy`, ideally requires a working compiler and the python development
|
|
headers/libs to build a C python extension for performance.
|
|
* Full options: https://github.com/microsoft/debugpy/wiki/Debug-configuration-settings
|
|
|
|
|
|
**Migrating from `vscode-python`**: change `"adapter": "vscode-python"` to
|
|
`"adapter": "debugpy"`.
|
|
|
|
```json
|
|
{
|
|
"configurations": {
|
|
"<name>: Launch": {
|
|
"adapter": "debugpy",
|
|
"configuration": {
|
|
"name": "<name>: Launch",
|
|
"type": "python",
|
|
"request": "launch",
|
|
"cwd": "<working directory>",
|
|
"python": "/path/to/python/interpreter/to/use",
|
|
"stopOnEntry": true,
|
|
"console": "externalTerminal",
|
|
"debugOptions": [],
|
|
"program": "<path to main python file>"
|
|
}
|
|
}
|
|
...
|
|
}
|
|
}
|
|
```
|
|
|
|
### Remote Debugging
|
|
|
|
In order to use remote debugging with debugpy, you have to connect Vimspector
|
|
directly to the application that is being debugged. This is easy, but it's a
|
|
little different from how we normally configure things. Specifically, you need
|
|
to:
|
|
|
|
|
|
* Start your application with debugpy, specifying the `--listen` argument. See
|
|
[the debugpy
|
|
documentation](https://github.com/microsoft/debugpy#debugpy-cli-usage) for
|
|
details.
|
|
* Use the built-in "multi-session" adapter. This just asks for the host/port to
|
|
connect to. For example:
|
|
|
|
```json
|
|
{
|
|
"configurations": {
|
|
"Python Attach": {
|
|
"adapter": "multi-session",
|
|
"configuration": {
|
|
"request": "attach",
|
|
"pathMappings": [
|
|
// mappings here (optional)
|
|
]
|
|
}
|
|
}
|
|
}
|
|
}
|
|
```
|
|
|
|
See [details of the launch
|
|
configuration](https://github.com/microsoft/debugpy/wiki/Debug-configuration-settings)
|
|
for explanation of things like `pathMappings`.
|
|
|
|
Additional documentation, including how to do this when the remote machine can
|
|
only be contacted via SSH [are provided by
|
|
debugpy](https://github.com/microsoft/debugpy/wiki/Debugging-over-SSH).
|
|
|
|
### Remote launch and attach
|
|
|
|
If you're feeling fancy, checkout the [reference guide][remote-debugging] for
|
|
an example of getting Vimspector to remotely launch and attach.
|
|
|
|
### Legacy: vscode-python
|
|
|
|
* No longer installed by default - please pass `--force-enable-python.legacy` if
|
|
you just want to continue using your working setup.
|
|
* [vscode-python](https://github.com/Microsoft/vscode-python)
|
|
* NOTE: You must be running `node` 10. See [this issue](https://github.com/puremourning/vimspector/issues/105)
|
|
|
|
```json
|
|
{
|
|
"configurations": {
|
|
"<name>: Launch": {
|
|
"adapter": "vscode-python",
|
|
"configuration": {
|
|
"name": "<name>: Launch",
|
|
"type": "python",
|
|
"request": "launch",
|
|
"cwd": "<working directory>",
|
|
"stopOnEntry": true,
|
|
"console": "externalTerminal",
|
|
"debugOptions": [],
|
|
"program": "<path to main python file>"
|
|
}
|
|
}
|
|
...
|
|
}
|
|
}
|
|
```
|
|
|
|
## TCL
|
|
|
|
* TCL (TclProDebug)
|
|
|
|
See [my fork of TclProDebug](https://github.com/puremourning/TclProDebug) for instructions.
|
|
|
|
## C♯
|
|
|
|
* C# - dotnet core
|
|
|
|
Install with `install_gadget.py --force-enable-csharp` or `:VimspectorInstall
|
|
netcoredbg`
|
|
|
|
```json
|
|
{
|
|
"configurations": {
|
|
"launch - netcoredbg": {
|
|
"adapter": "netcoredbg",
|
|
"configuration": {
|
|
"request": "launch",
|
|
"program": "${workspaceRoot}/bin/Debug/netcoreapp2.2/csharp.dll",
|
|
"args": [],
|
|
"stopAtEntry": true,
|
|
"cwd": "${workspaceRoot}"
|
|
}
|
|
}
|
|
}
|
|
}
|
|
```
|
|
|
|
* C# - mono
|
|
|
|
Install with `install_gadget.py --force-enable-csharp` or `:VimspectorInstall
|
|
vscode-mono-debug`.
|
|
|
|
***Known not to work.***
|
|
|
|
```json
|
|
{
|
|
"configurations": {
|
|
"launch - mono": {
|
|
"adapter": "vscode-mono-debug",
|
|
"configuration": {
|
|
"request": "launch",
|
|
"program": "${workspaceRoot}/bin/Debug/netcoreapp2.2/csharp.dll",
|
|
"args": [],
|
|
"cwd": "${workspaceRoot}",
|
|
"runtimeExecutable": "mono",
|
|
"runtimeArgs": [],
|
|
"env": [],
|
|
"externalConsole": false,
|
|
"console": "integratedTerminal"
|
|
}
|
|
}
|
|
}
|
|
}
|
|
```
|
|
|
|
## Go
|
|
|
|
* Go
|
|
|
|
Requires:
|
|
|
|
* `install_gadget.py --enable-go` or `:VimspectorInstall vscode-go`
|
|
* [Delve][delve-install] installed, e.g. `go get -u github.com/go-delve/delve/cmd/dlv`
|
|
* Delve to be in your PATH, or specify the `dlvToolPath` launch option
|
|
|
|
```json
|
|
{
|
|
"configurations": {
|
|
"run": {
|
|
"adapter": "vscode-go",
|
|
"configuration": {
|
|
"request": "launch",
|
|
"program": "${fileDirname}",
|
|
"mode": "debug",
|
|
"dlvToolPath": "$HOME/go/bin/dlv"
|
|
}
|
|
}
|
|
}
|
|
}
|
|
```
|
|
|
|
See the vscode-go docs for
|
|
[troubleshooting information](https://github.com/golang/vscode-go/blob/master/docs/debugging.md#troubleshooting)
|
|
|
|
## PHP
|
|
|
|
This uses the php-debug, see
|
|
https://marketplace.visualstudio.com/items?itemName=felixfbecker.php-debug
|
|
|
|
Requires:
|
|
|
|
* (optional) Xdebug helper for chrome https://chrome.google.com/webstore/detail/xdebug-helper/eadndfjplgieldjbigjakmdgkmoaaaoc
|
|
* `install_gadget.py --force-enable-php` or `:VimspectorInstall
|
|
vscode-php-debug`
|
|
* configured php xdebug extension
|
|
```ini
|
|
zend_extension=xdebug.so
|
|
xdebug.remote_enable=on
|
|
xdebug.remote_handler=dbgp
|
|
xdebug.remote_host=localhost
|
|
xdebug.remote_port=9000
|
|
```
|
|
replace `localhost` with the ip of your workstation.
|
|
|
|
lazy alternative
|
|
```ini
|
|
zend_extension=xdebug.so
|
|
xdebug.remote_enable=on
|
|
xdebug.remote_handler=dbgp
|
|
xdebug.remote_connect_back=true
|
|
xdebug.remote_port=9000
|
|
```
|
|
|
|
* .vimspectory.json
|
|
```json
|
|
{
|
|
"configurations": {
|
|
"Listen for XDebug": {
|
|
"adapter": "vscode-php-debug",
|
|
"configuration": {
|
|
"name": "Listen for XDebug",
|
|
"type": "php",
|
|
"request": "launch",
|
|
"port": 9000,
|
|
"stopOnEntry": false,
|
|
"pathMappings": {
|
|
"/var/www/html": "${workspaceRoot}"
|
|
}
|
|
}
|
|
},
|
|
"Launch currently open script": {
|
|
"adapter": "vscode-php-debug",
|
|
"configuration": {
|
|
"name": "Launch currently open script",
|
|
"type": "php",
|
|
"request": "launch",
|
|
"program": "${file}",
|
|
"cwd": "${fileDirname}",
|
|
"port": 9000
|
|
}
|
|
}
|
|
}
|
|
}
|
|
```
|
|
|
|
### Debug web application
|
|
append `XDEBUG_SESSION_START=xdebug` to your query string
|
|
```
|
|
curl "http://localhost?XDEBUG_SESSION_START=xdebug"
|
|
```
|
|
or use the previously mentioned Xdebug Helper extension (which sets a `XDEBUG_SESSION` cookie)
|
|
|
|
### Debug cli application
|
|
```
|
|
export XDEBUG_CONFIG="idekey=xdebug"
|
|
php <path to script>
|
|
```
|
|
|
|
## JavaScript, TypeScript, etc.
|
|
|
|
* Node.js
|
|
|
|
Requires:
|
|
|
|
* `install_gadget.py --force-enable-node`
|
|
* For installation, a Node.js environemt that is < node 12. I believe this is an
|
|
incompatibility with gulp. Advice, use [nvm][] with `nvm install --lts 10; nvm
|
|
use --lts 10; ./install_gadget.py --force-enable-node ...`
|
|
* Options described here:
|
|
https://code.visualstudio.com/docs/nodejs/nodejs-debugging
|
|
* Example: `support/test/node/simple`
|
|
|
|
```json
|
|
{
|
|
"configurations": {
|
|
"run": {
|
|
"adapter": "vscode-node",
|
|
"configuration": {
|
|
"request": "launch",
|
|
"protocol": "auto",
|
|
"stopOnEntry": true,
|
|
"console": "integratedTerminal",
|
|
"program": "${workspaceRoot}/simple.js",
|
|
"cwd": "${workspaceRoot}"
|
|
}
|
|
}
|
|
}
|
|
}
|
|
```
|
|
|
|
* Chrome
|
|
|
|
This uses the chrome debugger, see
|
|
https://marketplace.visualstudio.com/items?itemName=msjsdiag.debugger-for-chrome.
|
|
|
|
It allows you to debug scripts running inside chrome from within Vim.
|
|
|
|
* `./install_gadget.py --force-enable-chrome` or `:VimspectorInstall
|
|
debugger-for-chrome`
|
|
* Example: `support/test/chrome`
|
|
|
|
```json
|
|
{
|
|
"configurations": {
|
|
"launch": {
|
|
"adapter": "chrome",
|
|
"configuration": {
|
|
"request": "launch",
|
|
"url": "http://localhost:1234/",
|
|
"webRoot": "${workspaceRoot}/www"
|
|
}
|
|
}
|
|
}
|
|
}
|
|
```
|
|
|
|
## Java
|
|
|
|
Vimspector works well with the [java debug server][java-debug-server], which
|
|
runs as a jdt.ls (Java Language Server) plugin, rather than a standalone
|
|
debug adapter.
|
|
|
|
Vimspector is not in the business of running language servers, only debug
|
|
adapters, so this means that you need a compatible Language Server Protocol
|
|
editor plugin to use Java. I recommend [YouCompleteMe][], which has full support
|
|
for jdt.ls, and most importantly a trivial way to load the debug adapter and to
|
|
use it with Vimspector.
|
|
|
|
### Usage with YouCompleteMe
|
|
|
|
* Set up [YCM for java][YcmJava].
|
|
* Get Vimspector to download the java debug plugin:
|
|
`install_gadget.py --force-enable-java <other options...>` or
|
|
`:VimspectorInstall java-debug-adapter`
|
|
* Configure Vimspector for your project using the `vscode-java` adapter, e.g.:
|
|
|
|
```json
|
|
{
|
|
"configurations": {
|
|
"Java Attach": {
|
|
"adapter": "vscode-java",
|
|
"configuration": {
|
|
"request": "attach",
|
|
"hostName": "${host}",
|
|
"port": "${port}",
|
|
"sourcePaths": [
|
|
"${workspaceRoot}/src/main/java",
|
|
"${workspaceRoot}/src/test/java"
|
|
]
|
|
}
|
|
}
|
|
}
|
|
}
|
|
```
|
|
|
|
* Tell YCM to load the debugger plugin. This should be the `gadgets/<os>`
|
|
directory, not any specific adapter. e.g. in `.vimrc`
|
|
|
|
```viml
|
|
" Tell YCM where to find the plugin. Add to any existing values.
|
|
let g:ycm_java_jdtls_extension_path = [
|
|
\ '</path/to/Vimspector/gadgets/<os>'
|
|
\ ]
|
|
```
|
|
|
|
* Create a mapping, such as `<leader><F5>` to start the debug server and launch
|
|
vimspector, e.g. in `~/.vim/ftplugin/java.vim`:
|
|
|
|
```viml
|
|
let s:jdt_ls_debugger_port = 0
|
|
function! s:StartDebugging()
|
|
if s:jdt_ls_debugger_port <= 0
|
|
" Get the DAP port
|
|
let s:jdt_ls_debugger_port = youcompleteme#GetCommandResponse(
|
|
\ 'ExecuteCommand',
|
|
\ 'vscode.java.startDebugSession' )
|
|
|
|
if s:jdt_ls_debugger_port == ''
|
|
echom "Unable to get DAP port - is JDT.LS initialized?"
|
|
let s:jdt_ls_debugger_port = 0
|
|
return
|
|
endif
|
|
endif
|
|
|
|
" Start debugging with the DAP port
|
|
call vimspector#LaunchWithSettings( { 'DAPPort': s:jdt_ls_debugger_port } )
|
|
endfunction
|
|
|
|
nnoremap <silent> <buffer> <Leader><F5> :call <SID>StartDebugging()<CR>
|
|
|
|
```
|
|
|
|
You can then use `<Leader><F5>` to start debugging rather than just `<F5>`.
|
|
|
|
If you see "Unable to get DAP port - is JDT.LS initialized?", try running
|
|
`:YcmCompleter ExecuteCommand vscode.java.startDebugSession` and note the
|
|
output. If you see an error like `ResponseFailedException: Request failed:
|
|
-32601: No delegateCommandHandler for vscode.java.startDebugSession`, make sure
|
|
that:
|
|
* Your YCM jdt.ls is actually working, see the
|
|
[YCM docs](https://github.com/ycm-core/YouCompleteMe#troubleshooting) for
|
|
troubleshooting
|
|
* The YCM jdt.ls has had time to initialize before you start the debugger
|
|
* That `g:ycm_java_jdtls_extension_path` is set in `.vimrc` or prior to YCM
|
|
starting
|
|
|
|
For the launch arguments, see the
|
|
[vscode document](https://code.visualstudio.com/docs/java/java-debugging).
|
|
|
|
### Other LSP clients
|
|
|
|
See [this issue](https://github.com/puremourning/vimspector/issues/3) for more
|
|
background.
|
|
|
|
## Lua
|
|
|
|
Lua is supported through
|
|
[local-lua-debugger-vscode](https://github.com/tomblind/local-lua-debugger-vscode).
|
|
This debugger uses stdio to communicate with the running process, so calls to
|
|
`io.read` will cause problems.
|
|
|
|
* `./install_gadget.py --enable-lua` or `:VimspectorInstall local-lua-debugger-vscode`
|
|
* Examples: `support/test/lua/simple` and `support/test/lua/love`
|
|
|
|
```json
|
|
{
|
|
"$schema": "https://puremourning.github.io/vimspector/schema/vimspector.schema.json#",
|
|
"configurations": {
|
|
"lua": {
|
|
"adapter": "lua-local",
|
|
"configuration": {
|
|
"request": "launch",
|
|
"type": "lua-local",
|
|
"cwd": "${workspaceFolder}",
|
|
"program": {
|
|
"lua": "lua",
|
|
"file": "${file}"
|
|
}
|
|
}
|
|
},
|
|
"luajit": {
|
|
"adapter": "lua-local",
|
|
"configuration": {
|
|
"request": "launch",
|
|
"type": "lua-local",
|
|
"cwd": "${workspaceFolder}",
|
|
"program": {
|
|
"lua": "luajit",
|
|
"file": "${file}"
|
|
}
|
|
}
|
|
},
|
|
"love": {
|
|
"adapter": "lua-local",
|
|
"configuration": {
|
|
"request": "launch",
|
|
"type": "lua-local",
|
|
"cwd": "${workspaceFolder}",
|
|
"program": {
|
|
"command": "love"
|
|
},
|
|
"args": ["${workspaceFolder}"]
|
|
}
|
|
}
|
|
}
|
|
}
|
|
```
|
|
|
|
## Other servers
|
|
|
|
* Java - vscode-javac. This works, but is not as functional as Java Debug
|
|
Server. Take a look at [this
|
|
comment](https://github.com/puremourning/vimspector/issues/3#issuecomment-576916076)
|
|
for instructions.
|
|
|
|
|
|
# Customisation
|
|
|
|
There is very limited support for customistaion of the UI.
|
|
|
|
## Changing the default signs
|
|
|
|
Vimsector uses the following signs internally. If they are defined before
|
|
Vimsector uses them, they will not be replaced. So to customise the signs,
|
|
define them in your `vimrc`.
|
|
|
|
|
|
| Sign | Description | Priority |
|
|
|------------------------|-------------------------------------|----------|
|
|
| `vimspectorBP` | Line breakpoint | 9 |
|
|
| `vimspectorBPCond` | Conditional line breakpiont | 9 |
|
|
| `vimspectorBPDisabled` | Disabled breakpoint | 9 |
|
|
| `vimspectorPC` | Program counter (i.e. current line) | 200 |
|
|
| `vimspectorPCBP` | Program counter and breakpoint | 200 |
|
|
|
|
The default symbols are the equivalent of something like the following:
|
|
|
|
```viml
|
|
sign define vimspectorBP text=\ ● texthl=WarningMsg
|
|
sign define vimspectorBPCond text=\ ◆ texthl=WarningMsg
|
|
sign define vimspectorBPDisabled text=\ ● texthl=LineNr
|
|
sign define vimspectorPC text=\ ▶ texthl=MatchParen linehl=CursorLine
|
|
sign define vimspectorPCBP text=●▶ texthl=MatchParen linehl=CursorLine
|
|
```
|
|
|
|
If the signs don't display properly, your font probably doesn't contain these
|
|
glyphs. You can easily change them by deifining the sign in your vimrc. For
|
|
example, you could put this in your `vimrc` to use some simple ASCII symbols:
|
|
|
|
```viml
|
|
sign define vimspectorBP text=o texthl=WarningMsg
|
|
sign define vimspectorBPCond text=o? texthl=WarningMsg
|
|
sign define vimspectorBPDisabled text=o! texthl=LineNr
|
|
sign define vimspectorPC text=\ > texthl=MatchParen
|
|
sign define vimspectorPCBP text=o> texthl=MatchParen
|
|
```
|
|
|
|
## Sign priority
|
|
|
|
Many different plugins provide signs for various purposes. Examples include
|
|
diagnostic signs for code errors, etc. Vim provides only a single priority to
|
|
determine which sign should be displayed when multiple signs are placed at a
|
|
single line. If you are finding that other signs are interfering with
|
|
vimspector's (or vice-versa), you can customise the priority used by vimspector
|
|
by setting the following dictionary:
|
|
|
|
```viml
|
|
let g:vimspector_sign_priority = {
|
|
\ '<sign-name>': <priority>,
|
|
\ }
|
|
```
|
|
|
|
For example:
|
|
|
|
```viml
|
|
let g:vimspector_sign_priority = {
|
|
\ 'vimspectorBP': 3,
|
|
\ 'vimspectorBPCond': 2,
|
|
\ 'vimspectorBPDisabled': 1,
|
|
\ 'vimspectorPC': 999,
|
|
\ }
|
|
```
|
|
|
|
All keys are optional. If a sign is not customised, the default priority it used
|
|
(as shown above).
|
|
|
|
See `:help sign-priority`. The default priority is 10, larger numbers override
|
|
smaller ones.
|
|
|
|
## Changing the default window sizes
|
|
|
|
> ***Please Note***: This cusomiation API is ***unstable***, meaning that it may
|
|
change at any time. I will endeavour to reduce the impact of this and annouce
|
|
changes in Gitter.
|
|
|
|
The following options control the default sizes of the UI windows (all of them
|
|
are numbers)
|
|
|
|
- `g:vimspector_sidebar_width` (default: 50 columns):
|
|
The width in columns of the left utility windows (variables, watches, stack
|
|
trace)
|
|
- `g:vimspector_bottombar_height` (default 10 lines):
|
|
The height in rows of the output window below the code window.
|
|
|
|
Example:
|
|
|
|
```viml
|
|
let g:vimspector_sidebar_width = 75
|
|
let g:vimspector_bottombar_height = 15
|
|
```
|
|
|
|
## Changing the terminal size
|
|
|
|
The terminal is typically created as a vertical split to the righ of the code
|
|
window, and that window is re-used for subsequent terminal buffers.
|
|
The following control the sizing of the terminal window used
|
|
for debuggee input/output when using Vim's built-in terminal.
|
|
|
|
- `g:vimspector_code_minwidth` (default: 82 columns):
|
|
Minimum number of columns to try and maintain for the code window when
|
|
splitting to create the terminal window.
|
|
- `g:vimspector_terminal_maxwidth` (default: 80 columns):
|
|
Maximum number of columns to use for the terminal.
|
|
- `g:vimspector_terminal_minwidth` (default: 10 columns):
|
|
Minimum number of columns to use when it is not possible to fit
|
|
`g:vimspector_terminal_maxwidth` columns for the terminal.
|
|
|
|
That's a lot of options, but essentially we try to make sure that there are at
|
|
least `g:vimspector_code_minwidth` columns for the main code window and that the
|
|
terminal is no wider than `g:vimspector_terminal_maxwidth` columns.
|
|
`g:vimspector_terminal_minwidth` is there to ensure that there's a reasonable
|
|
number of columns for the terminal even when there isn't enough horizontal space
|
|
to satisfy the other contraints.
|
|
|
|
Example:
|
|
|
|
```viml
|
|
let g:vimspector_code_minwidth = 90
|
|
let g:vimspector_terminal_maxwidth = 75
|
|
let g:vimspector_terminal_minwidth = 20
|
|
```
|
|
|
|
## Advanced UI customisation
|
|
|
|
> ***Please Note***: This cusomiation API is ***unstable***, meaning that it may
|
|
change at any time. I will endeavour to reduce the impact of this and annouce
|
|
changes in Gitter.
|
|
|
|
The above customisation of window sizes is limited intentionally to keep things
|
|
simple. Vimspector also provides a way for you to customise the UI without
|
|
restrictions, by running a `User` autocommand just after creating the UI or
|
|
opening the terminal. This requires you to write some vimscript, but allows you
|
|
to do things like:
|
|
|
|
* Hide a particular window or windows
|
|
* Move a particular window or windows
|
|
* Resize windows
|
|
* Have multiple windows for a particular buffer (say, you want 2 watch windows)
|
|
* etc.
|
|
|
|
You can essentially do anything you could do manually by writing a little
|
|
vimscript code.
|
|
|
|
The `User` autocommand is raised with `pattern` set with the following values:
|
|
|
|
* `VimspectorUICreated`: Just after setting up the UI for a debug session
|
|
* `VimspectorTerminalOpened`: Just after opening the terminal window for program
|
|
input/output.
|
|
|
|
The following global variable is set up for you to get access to the UI
|
|
elements: `g:vimspector_session_windows`. This is a `dict` with the following
|
|
keys:
|
|
|
|
* `g:vimspector_session_windows.tagpage`: The tab page for the session
|
|
* `g:vimspector_session_windows.variables`: Window ID of the variables window,
|
|
containing the `vimspector.Variables` buffer.
|
|
* `g:vimspector_session_windows.watches`: Window ID of the watches window,
|
|
containng the `vimspector.Watches` buffer.
|
|
* `g:vimspector_session_windows.stack_trace`: Window ID of the stack trade
|
|
window containing the `vimspector.StackTrace` buffer.
|
|
* `g:vimspector_session_windows.code`: Window ID of the code window.
|
|
* `g:vimspector_session_windows.output`: Window ID of the output window.
|
|
|
|
In addition, the following key is added when triggering the
|
|
`VimspectorTerminalOpened` event:
|
|
|
|
* `g:vimspector_session_windows.terminal`: Window ID of the terminal window
|
|
|
|
## Customising the WinBar
|
|
|
|
You can even customise the WinBar buttons by simply running the usual `menu`
|
|
(and `unmanu`) commands.
|
|
|
|
By default, Vimspector uses something a bit like this:
|
|
|
|
```viml
|
|
nnoremenu WinBar.■\ Stop :call vimspector#Stop()<CR>
|
|
nnoremenu WinBar.▶\ Cont :call vimspector#Continue()<CR>
|
|
nnoremenu WinBar.▷\ Pause :call vimspector#Pause()<CR>
|
|
nnoremenu WinBar.↷\ Next :call vimspector#StepOver()<CR>
|
|
nnoremenu WinBar.→\ Step :call vimspector#StepInto()<CR>
|
|
nnoremenu WinBar.←\ Out :call vimspector#StepOut()<CR>
|
|
nnoremenu WinBar.⟲: :call vimspector#Restart()<CR>
|
|
nnoremenu WinBar.✕ :call vimspector#Reset()<CR>
|
|
```
|
|
|
|
If you prefer a different layout or if the unicode symbols don't render
|
|
correctly in your font, you can customise this in the `VimspectorUICreated`
|
|
autocommand, for example:
|
|
|
|
```viml
|
|
func! CustomiseUI()
|
|
call win_gotoid( g:vimspector_session_windows.code )
|
|
" Clear the existing WinBar created by Vimspector
|
|
nunmenu WinBar
|
|
" Cretae our own WinBar
|
|
nnoremenu WinBar.Kill :call vimspector#Stop()<CR>
|
|
nnoremenu WinBar.Continue :call vimspector#Continue()<CR>
|
|
nnoremenu WinBar.Pause :call vimspector#Pause()<CR>
|
|
nnoremenu WinBar.Step\ Over :call vimspector#StepOver()<CR>
|
|
nnoremenu WinBar.Step\ In :call vimspector#StepInto()<CR>
|
|
nnoremenu WinBar.Step\ Out :call vimspector#StepOut()<CR>
|
|
nnoremenu WinBar.Restart :call vimspector#Restart()<CR>
|
|
nnoremenu WinBar.Exit :call vimspector#Reset()<CR>
|
|
endfunction
|
|
|
|
augroup MyVimspectorUICustomistaion
|
|
autocmd!
|
|
autocmd User VimspectorUICreated call s:CustomiseUI()
|
|
augroup END
|
|
```
|
|
|
|
## Example
|
|
|
|
There is some example code in `support/custom_ui_vimrc` showing how you can use
|
|
the window IDs to modify various aspects of the UI using some basic vim
|
|
commands, primarily `win_gotoid` funciton and the `wincmd` ex command.
|
|
|
|
To try this out `vim -Nu support/custom_ui_vimrc <some file>`.
|
|
|
|
Here's a rather smaller example. A simple way to use this is to drop it into a
|
|
file named `my_vimspector_ui.vim` in `~/.vim/plugin` (or paste into your
|
|
`vimrc`):
|
|
|
|
```viml
|
|
" Set the basic sizes
|
|
let g:vimspector_sidebar_width = 80
|
|
let g:vimspector_code_minwidth = 85
|
|
let g:vimspector_terminal_minwidth = 75
|
|
|
|
function! s:CustomiseUI()
|
|
" Customise the basic UI...
|
|
|
|
" Close the output window
|
|
call win_gotoid( g:vimspector_session_windows.output )
|
|
q
|
|
endfunction
|
|
|
|
function s:SetUpTerminal()
|
|
" Customise the terminal window size/position
|
|
" For some reasons terminal buffers in Neovim have line numbers
|
|
call win_gotoid( g:vimspector_session_windows.terminal )
|
|
set norelativenumber nonumber
|
|
endfunction
|
|
|
|
augroup MyVimspectorUICustomistaion
|
|
autocmd!
|
|
autocmd User VimspectorUICreated call s:CustomiseUI()
|
|
autocmd User VimspectorTerminalOpened call s:SetUpTerminal()
|
|
augroup END
|
|
```
|
|
|
|
# FAQ
|
|
|
|
1. Q: Does it work? A: Yeah. It's a bit unpolished.
|
|
2. Q: Does it work with _this_ language? A: Probably, but it won't
|
|
necessarily be easy to work out what to put in the `.vimspector.json`. As you
|
|
can see above, some of the servers aren't really editor agnostic, and require
|
|
very-specific unique handling.
|
|
3. How do I stop it starting a new Terminal.app on macOS? See [this
|
|
comment](https://github.com/puremourning/vimspector/issues/90#issuecomment-577857322)
|
|
4. Can I specify answers to the annoying questions about exception breakpoints
|
|
in my `.vimspector.json` ? Yes, see [here][vimspector-ref-exception].
|
|
5. Do I have to specify the file to execute in `.vimspector.json`, or could it be the current vim file?
|
|
You don't need to. You can specify $file for the current active file. See [here][vimspector-ref-var] for complete list of replacements in the configuration file.
|
|
6. You allow comments in `.vimspector.json`, but Vim highlights these as errors,
|
|
do you know how to make this not-an-error? Yes, put this in
|
|
`~/.vim/after/syntax/json.vim`:
|
|
|
|
```viml
|
|
syn region jsonComment start="/\*" end="\*/"
|
|
hi link jsonCommentError Comment
|
|
hi link jsonComment Comment
|
|
```
|
|
|
|
7. What is the difference between a `gadget` and an `adapter`? A gadget is
|
|
somethin you install with `:VimspectorInstall` or `install_gadget.py`, an
|
|
`adapter` is something that Vimspector talks to (actually it's the Vimspector
|
|
config describing that thing). These are _usually_ one-to-one,
|
|
but in theory a single gadget can supply multiple `adapter` configs.
|
|
Typically this happens when a `gadget` supplies different `adapter` config
|
|
for, say remote debugging, or debugging in a container, etc.
|
|
8. The signs and winbar display funny symbols. How do i fix them? See
|
|
[this](#changing-the-default-signs) and [this](#customising-the-winbar)
|
|
|
|
# Motivation
|
|
|
|
A message from the author about the motivation for this plugin:
|
|
|
|
> Many development environments have a built-in debugger. I spend an inordinate
|
|
> amount of my time in Vim. I do all my development in Vim and I have even
|
|
> customised my workflows for building code, running tests etc.
|
|
>
|
|
> For many years I have observed myself, friends and colleagues have been
|
|
> writing `printf`, `puts`, `print`, etc. debugging statements in all sorts of
|
|
> files simply because there is no _easy_ way to run a debugger for _whatever_
|
|
> language we happen to be developing in.
|
|
>
|
|
> I truly believe that interactive, graphical debugging environments are the
|
|
> best way to understand and reason about both unfamiliar and familiar code, and
|
|
> that the lack of ready, simple access to a debugger is a huge hidden
|
|
> productivity hole for many.
|
|
>
|
|
> Don't get me wrong, I know there are literally millions of developers out
|
|
> there that are more than competent at developing without a graphical debugger,
|
|
> but I maintain that if they had the ability to _just press a key_ and jump
|
|
> into the debugger, it would be faster and more enjoyable that just cerebral
|
|
> code comprehension.
|
|
>
|
|
> I created Vimspector because I find changing tools frustrating. `gdb` for c++,
|
|
> `pdb` for python, etc. Each has its own syntax. Each its own lexicon. Each its
|
|
> own foibles.
|
|
>
|
|
> I designed the configuration system in such a way that the configuration can
|
|
> be committed to source control so that it _just works_ for any of your
|
|
> colleagues, friends, collaborators or complete strangers.
|
|
>
|
|
> I made remote debugging a first-class feature because that's a primary use
|
|
> case for me in my job.
|
|
>
|
|
> With Vimspector I can _just hit `<F5>`_ in all of the languages I develop in
|
|
> and debug locally or remotely using the exact same workflow, mappings and UI.
|
|
> I have integrated this with my Vim in such a way that I can hit a button and
|
|
> _run the test under the cursor in Vimspector_. This kind of integration has
|
|
> massively improved my workflow and productivity. It's even made the process
|
|
> of learning a new codebase... fun.
|
|
>
|
|
> \- Ben Jackson, Creator.
|
|
|
|
# License
|
|
|
|
[Apache 2.0](http://www.apache.org/licenses/LICENSE-2.0)
|
|
|
|
Copyright © 2018 Ben Jackson
|
|
|
|
# Sponsorship
|
|
|
|
If you like Vimspector so much that you're wiling to part with your hard-earned cash, please consider donating to one of the following charities, which are meaningful to the author of Vimspector (in order of prefernce):
|
|
|
|
* [Greyhound Rescue Wales](https://greyhoundrescuewales.co.uk)
|
|
* [Cancer Research UK](https://www.cancerresearchuk.org)
|
|
* [ICCF Holland](https://iccf.nl)
|
|
* Any charity of your choosing.
|
|
|
|
[ycmd]: https://github.com/Valloric/ycmd
|
|
[gitter]: https://gitter.im/vimspector/Lobby?utm_source=share-link&utm_medium=link&utm_campaign=share-link
|
|
[java-debug-server]: https://github.com/Microsoft/java-debug
|
|
[website]: https://puremourning.github.io/vimspector-web/
|
|
[delve]: https://github.com/go-delve/delve
|
|
[delve-install]: https://github.com/go-delve/delve/tree/master/Documentation/installation
|
|
[vimspector-ref]: https://puremourning.github.io/vimspector/configuration.html
|
|
[vimspector-ref-var]: https://puremourning.github.io/vimspector/configuration.html#replacements-and-variables
|
|
[vimspector-ref-exception]: https://puremourning.github.io/vimspector/configuration.html#exception-breakpoints
|
|
[vimspector-ref-config-selection]: https://puremourning.github.io/vimspector/configuration.html#configuration-selection
|
|
[debugpy]: https://github.com/microsoft/debugpy
|
|
[YouCompleteMe]: https://github.com/ycm-core/YouCompleteMe#java-semantic-completion
|
|
[remote-debugging]: https://puremourning.github.io/vimspector/configuration.html#remote-debugging-support
|